Asset classes of all types declined again during the third quarter. The S & P 500 was down nearly 6% during the quarter, the MSCI All-Country World index declined nearly 8% and the Bloomberg Global Aggregate Bond Index also declined by 7.4%. Again, market volatility caused significant extremes in relative performance: Emerging Market Equities (-12.5%), Mid Cap Value (-4.6%) vs. Mid Cap Growth (+1.1%); Short-term Bonds (-1.9%) vs Long-term Bonds (-11.2%); Utility Stocks (-8%) vs Consumer Discretionary Stocks (+2%). Precious metals were down again (Gold -8%, Silver -4%) while the broad Commodities index joined in by declining about -10%. The returns for the nine months ending September 30, 2022 remain deep in negative territory, with nearly all asset classes down nearly 20%, the exception being the commodity index, which remains up 20%, led by energy. Another standout has been the NASDAQ, which has declined nearly 33% year-to-date. The damage has been led by various high multiple (P/E) stocks such as Netflix (-60%), Meta (aka, Facebook, -59%), and Nvidia (-57%).
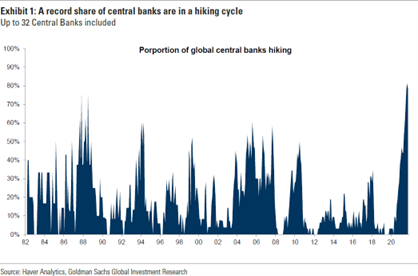
Without question, this year’s volatility has been driven by central banks around the World finally acknowledging inflation as a problem that needs to be dealt with before inflation expectations become unanchored – something we have discussed in prior client letters. As you can see in the chart below, central banks have been unusually unanimous in raising interest rates so far this year.
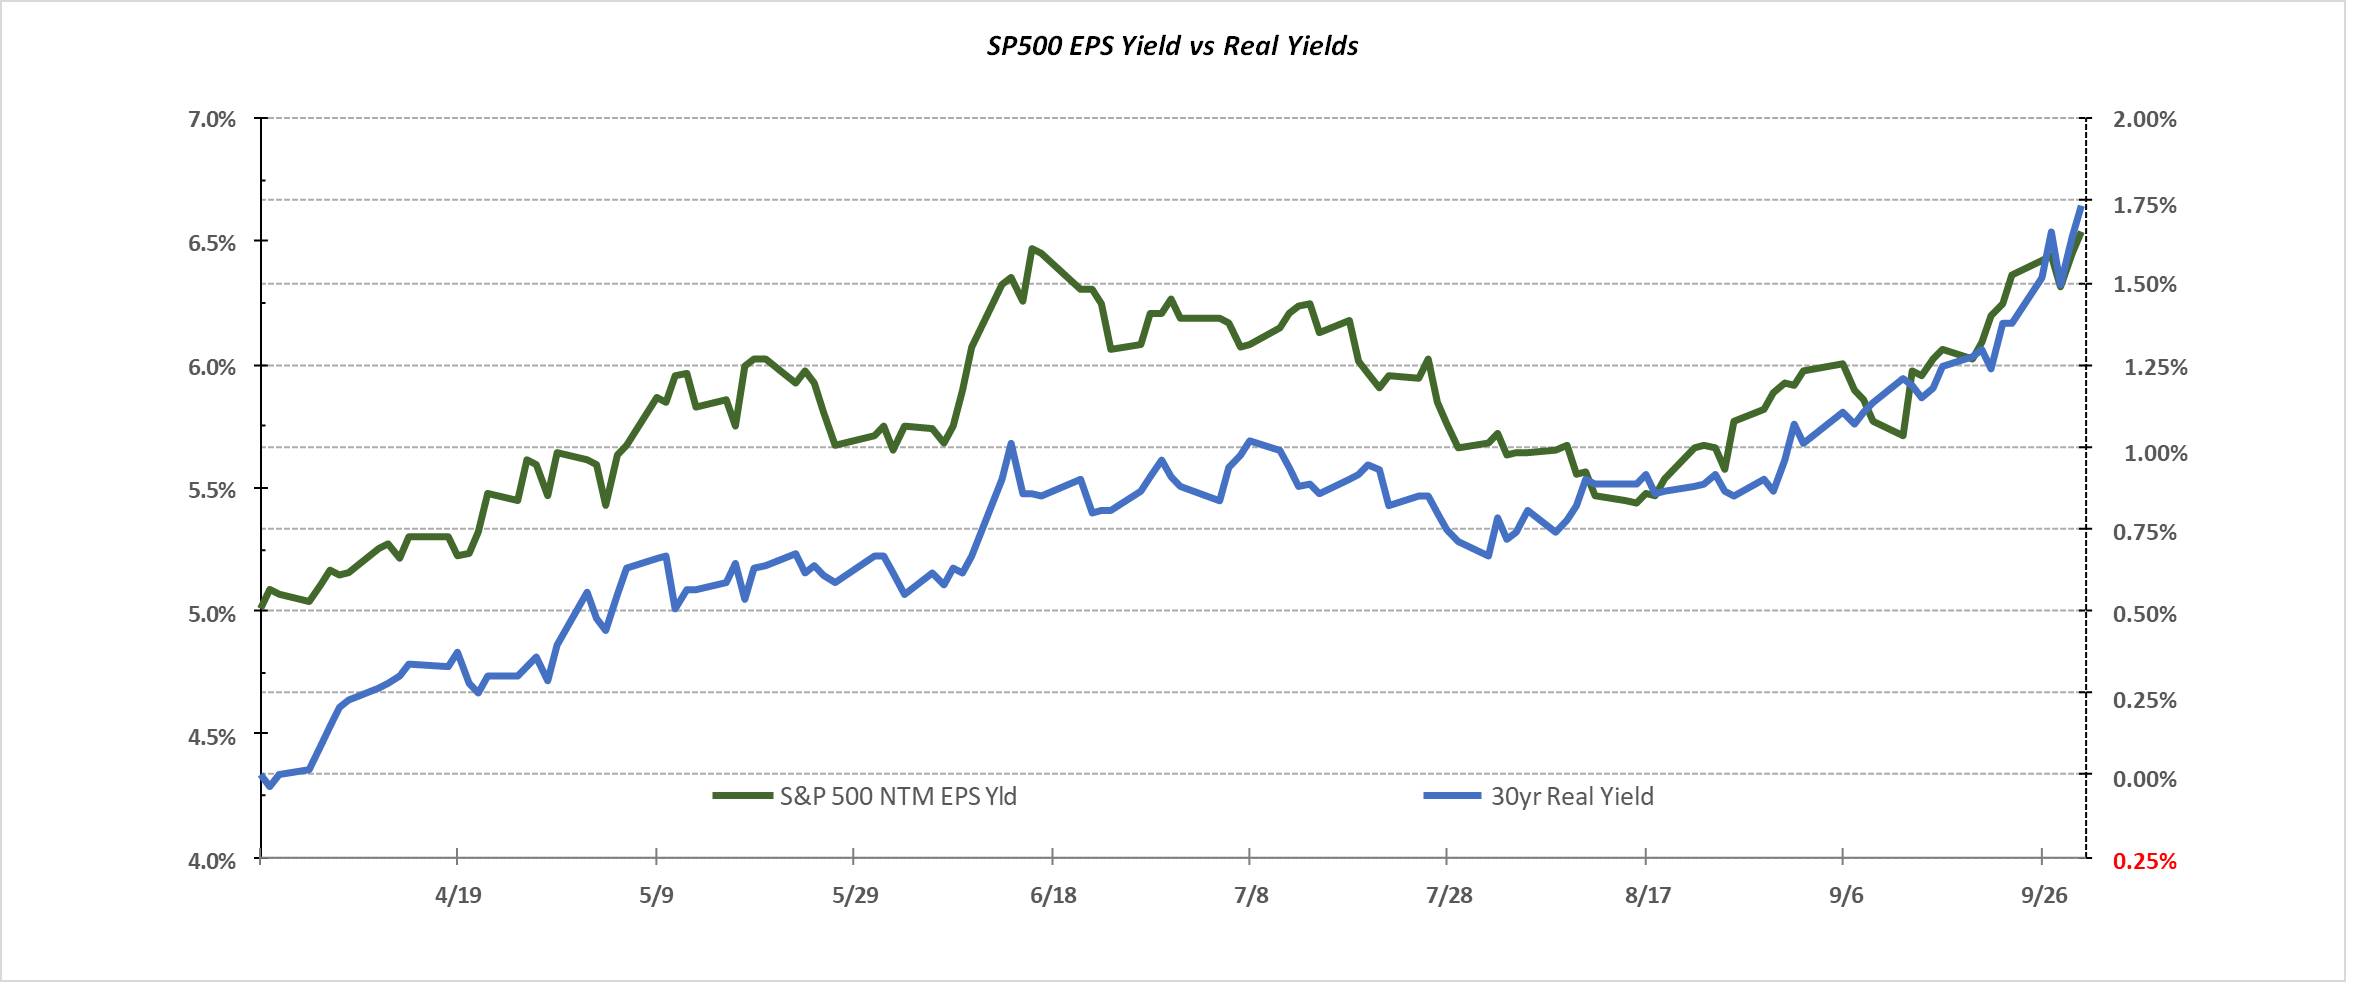
The speed of this hiking cycle has put significant upward pressure on real (inflation-adjusted) interest rates, which are foundational inputs into many equity and fixed income valuation models (including ours). The chart below compares the 30 year real yield (30 year TIPS) and the next 12 month earnings yield of the S & P 500 over the last six months. The valuation of the S & P 500 has moved largely in lock step with the 30 year TIPS market (please note, the Earnings Per Share yield is the inverse of the P/E ratio or E/P, similar to dividend yield).
 Source: TPW and Factset.
The resulting decline in valuations has moved the S & P 500 back to nearly fair value, with Small Cap and Mid Cap stocks in the US having become relatively undervalued. This presumes that corporate earnings over the next 12 months hold up reasonably well and we do not enter a deep and protracted recession.
With that review as a backdrop, we are pleased to report that, while negative on an absolute basis, all of our risk model portfolios have again outperformed their weighted benchmark for both the third quarter as well as the year to date period. By way of example, our Moderate Portfolio (40% Equity/40% Fixed Income/20% Liquid Alternatives) outperformed by nearly 3.0% during the third quarter and has returned -12.9% (net of fees) for the first nine months of 2022, while its weighted benchmark1 returned -19.6% YTD.
The “60/40 portfolio” has long been revered as a trusty guidepost for the moderate risk investor—a 60% allocation to equities with the intention of providing capital appreciation and a 40% allocation to fixed income to potentially offer income and risk mitigation (60/40). In the decade ending 2021, equities had marched to new highs, interest rates had descended to new lows, a simple mix of 60% S & P 500® stocks, and 40% Bloomberg US Aggregate Index® bonds would have likely satisfied most investors, returning over 11% on an annualized basis. Year to date though, has been particularly challenging for the 60/40 portfolio, which declined by 20% for the first nine months of the year. This has prompted the question—is the 60/40 dead? Although returns this year have been unsettling to say the least, a double-digit decline in the 60/40 portfolio is not unheard of. Since 1980, for example, there have been nine instances in which the 60/40 fell more than 10% within a given year. Yet, investors who were patient with their portfolios were often rewarded with a rebound. In five of those years, returns still ended the year positive. In eight of the nine instances, returns the following calendar year were positive, with an average return of over 17%.
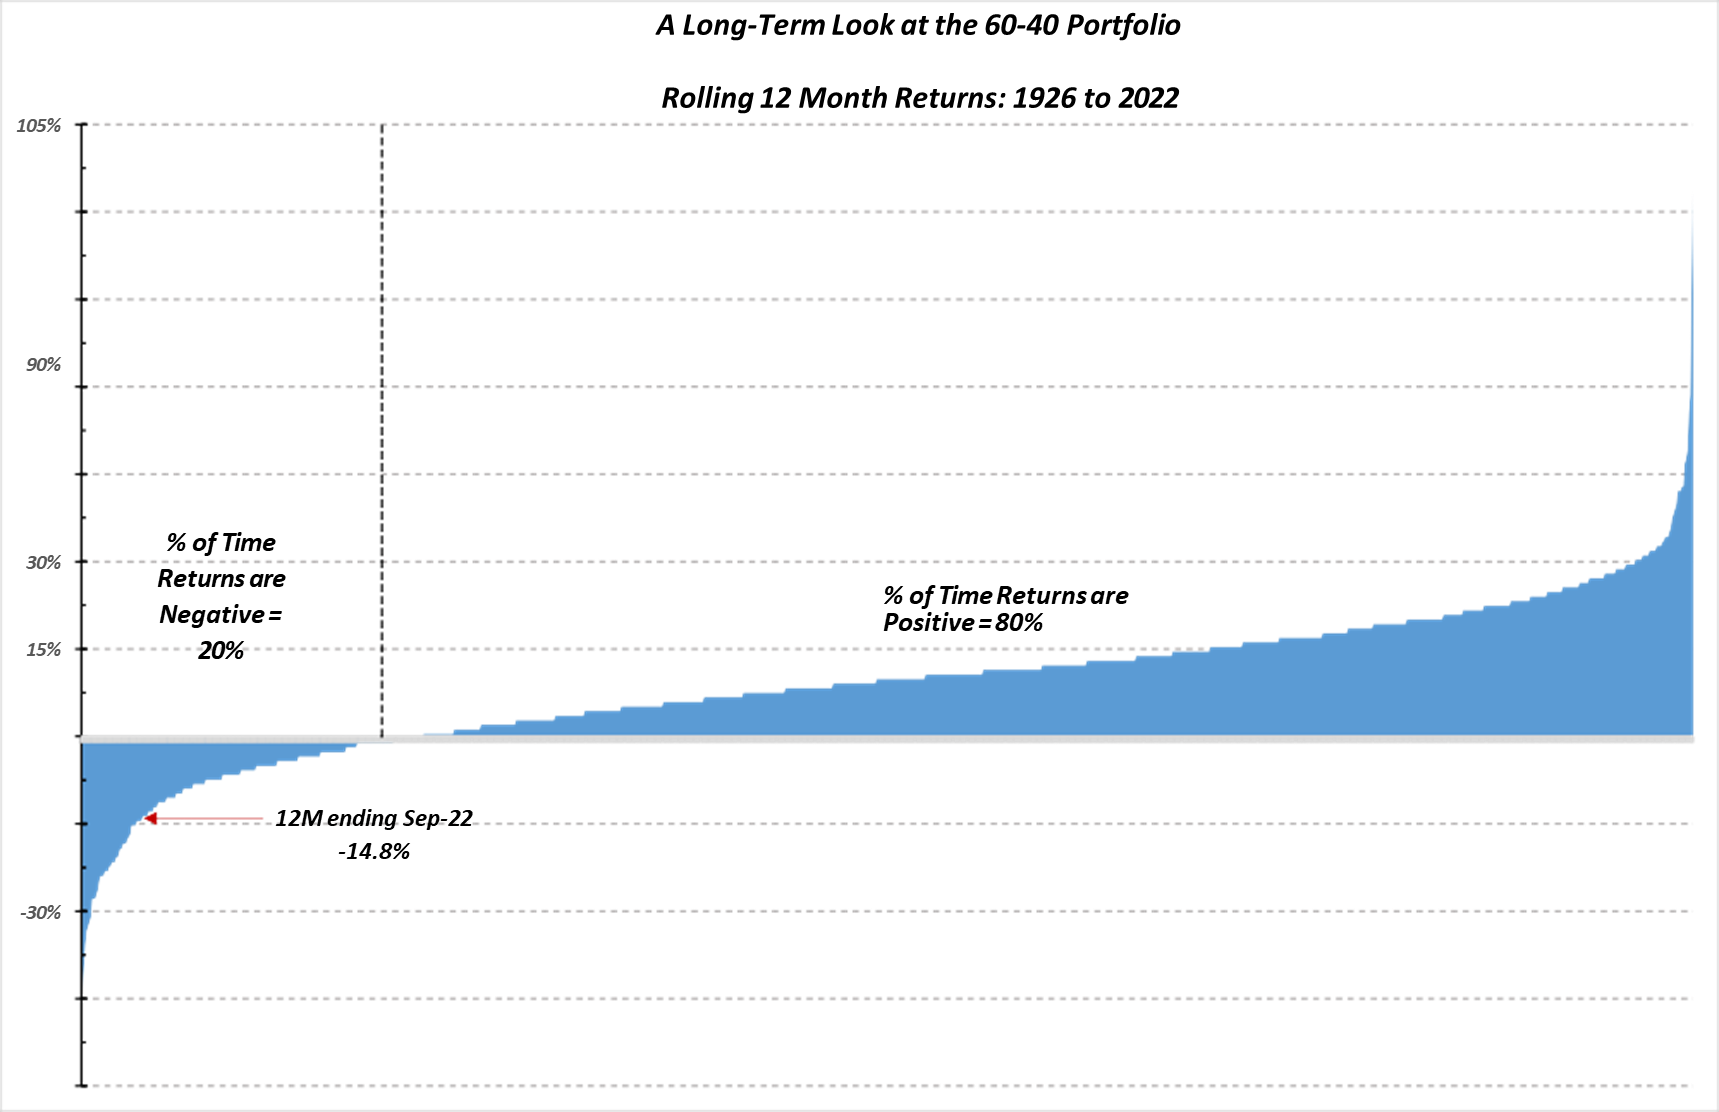
We decided to go further back to 1926 and look at rolling 12-month returns for the 60/40 portfolio in order to get a larger statistically significant sample. The summary of those (1,150) rolling 12-month periods is depicted in the chart below.
Source: TPW, Factset, and Ibbotson Associates.
As you can see, the returns are heavily skewed to the positive with only 20% of time showing negative returns. This is one of the main reasons why we at Twelve Points construct our risk models as we do, combining Equity and Fixed Income asset classes together, with the goal of maximizing risk-adjusted returns while reducing volatility.
While it has been a painful ride down, the reset in valuations creates opportunity for subsequent returns. The near-term environment for stocks and bonds could continue to be challenging with the Fed aggressively raising rates to tame inflation. However, it is likely that most, if not all, of the Fed rate hiking cycle will be behind us by the end of the first quarter of next year. Bonds have struggled while rates have risen, but as investor concerns shift to slowing growth, there is opportunity for yields to fall (and bond prices to rise). Stocks may face additional headwinds as earnings expectations are revised down, but significant repricing has already occurred. Therefore, it is important for investors to focus not on where returns have been, but instead where they could be going in the months and years ahead.
We at Twelve Points Wealth hope you and your families are well and enjoy the upcoming holiday season. Please call or email if you have any questions.
Disclaimer: Historical data is not a guarantee that any of the events described will occur or that any strategy will be successful. Past performance is not indicative of future results. Returns and data cited above are from various sources including Factset, Bloomberg, Russell Associates, S&P Dow Jones, MSCI Inc., The St. Louis Federal Reserve, and Factset, Inc. The content is developed from sources believed to be providing accurate information.
The information in this material is not intended as tax or legal advice. Please consult legal or tax professionals for specific information regarding your individual situation. The opinions expressed and material provided are for general information and should not be considered a solicitation for the purchase or sale of any security. Investing involves risks, including possible loss of principal. Please consider the investment objectives, risks, charges, and expenses of any security carefully before investing.
Twelve Points Wealth Management, LLC is an investment adviser located in Concord, Massachusetts. Twelve Points Wealth Management, LLC is registered with the Securities and Exchange Commission (SEC). Registration of an investment adviser does not imply any specific level of skill or training and does not constitute an endorsement of the firm by the Commission. Twelve Points Wealth Management, LLC only transacts business in states in which it is properly registered or is excluded or exempted from registration.
1 **** Weighted Benchmark = 40% MSCI All Country World Index + 40% Bloomberg Barclays Global Aggregate Bond Index + 20% HFRI Liquid Alts Index.