The quarter started with a continuation of the late summer weakness we discussed in our last letter but ended with a record rally that enabled the equity market to erase the losses of 2022. The S & P 500® was up 11.6% during the quarter, the MSCI All-Country World Index® returned 11.2% and the Bloomberg Global Aggregate Bond Index rose by 8.1% as global interest rates declined. US Mega Cap Growth stocks rose by 14.6 % surpassed only by the S & P 600 Small Cap Index which rose by 15.1%. Returns among other asset classes were clustered as well. For example: U.S. Mid Cap Value (+12.0%); Mid Cap Growth (+14.5%); Mega Cap Value (+8.0%%) and Small Cap Value stocks (+15.3%). Short-term Bonds (+2.5%) and Long-term Bonds (+12.9%) showed significant divergence as longer maturity bonds reacted to a major reset of interest rate expectations among investors driven by dovish comments by the US Federal Reserve implying that the Fed was done raising interest rates for this cycle and is looking to begin cutting rates in 2024. Energy stocks (-6%) were the lone negative sector this quarter as the price of oil fell about 16%. There was further divergence in performance among sectors: Financials (+14%); Industrial Stocks (+13%); Materials Stocks (+10%); Consumer Discretionary Stocks (+11%); Technology (+18%); REITs (+19%). Weakest among the sectors were the Consumer Staples (+6%) and Healthcare (+6%), which usually lag during a strong rally in equities as these two groups tend to be viewed as defensive holdings. Precious metals were up (Gold +12%) while the broad Commodities indices were down 6-10% depending on their Energy weighting. The Global 60/40 portfolio returned 10.0% for the quarter reflecting the “everything rally” nature of the quarter. All of our risk model portfolios performed in-line with their weighted benchmarks for the quarter.
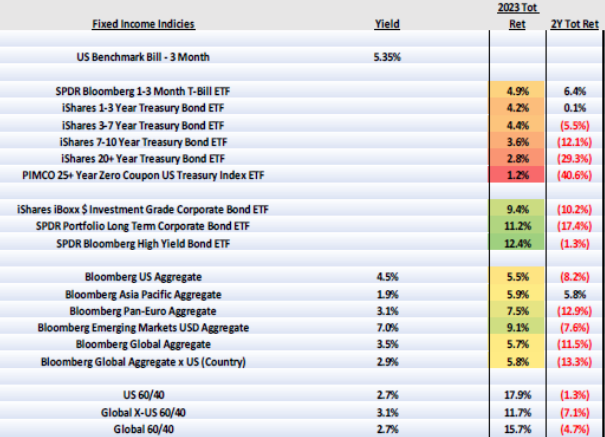 Looking at the year 2023 as a whole, the performance divergences were stark to say the least as evidenced by the two tables, right and below. In a year marked by aggressive Fed tightening, a mini bank crisis, stubborn inflation, geopolitical tensions and volatility – in both equity and fixed income markets – driven by investor’s recalibration to a world where capital has a cost again, it is notable that such a broad array of asset classes ended the year posting positive returns. Despite the strong results in 2023, it is important to remember that while the S & P 500 has returned to the levels last seen on 12/31/2021, most asset classes, and especially the fixed income markets, haven’t come close to repairing the damage of 2022 (see last column on both charts). For example, both the US 60/40 and the Global 60/40 portfolios still show negative returns over the last two years.
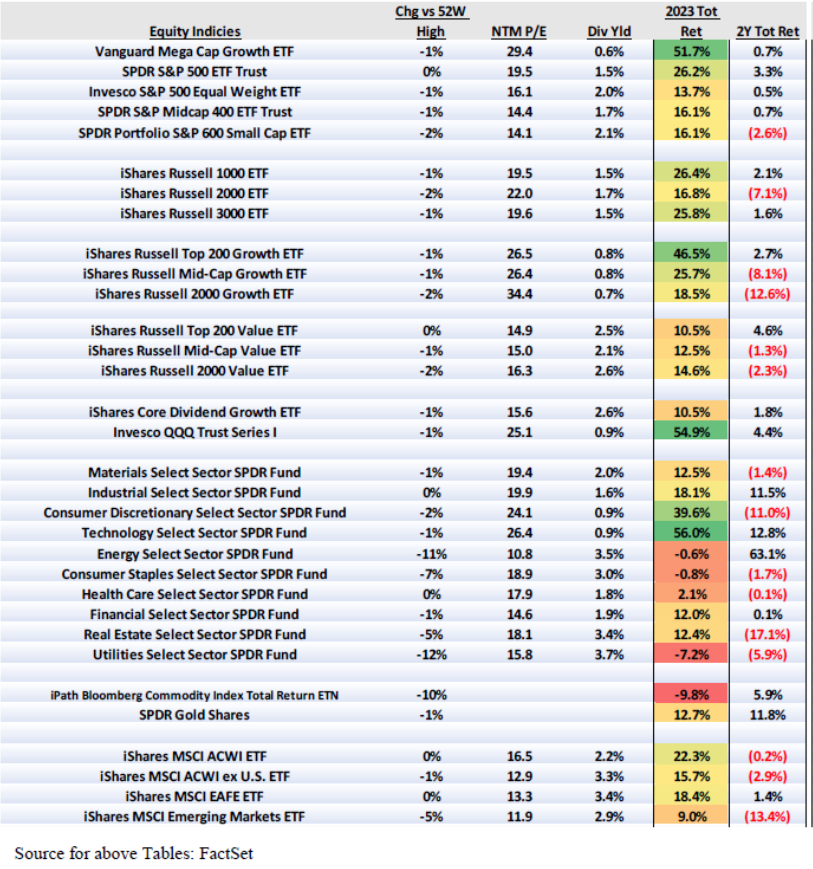
Back in July, we introduced you to the “Magnificent Seven” – the seven largest stocks in the S & P 500 that had driven most of the equity market’s year to date performance through June of 2023. That leadership continued during the fourth quarter as discussed above. The group’s performance not only impacted the S & P 500 but the All-Country World Index (our main equity benchmark) as well. The following is from Investor’s Business Daily from late November:
These ‘Perfect 10’ Stocks Drive 87% Of World’s Stock Gains
MATT KRANTZ, Investors Business Daily
08:00 AM ET 11/20/2023
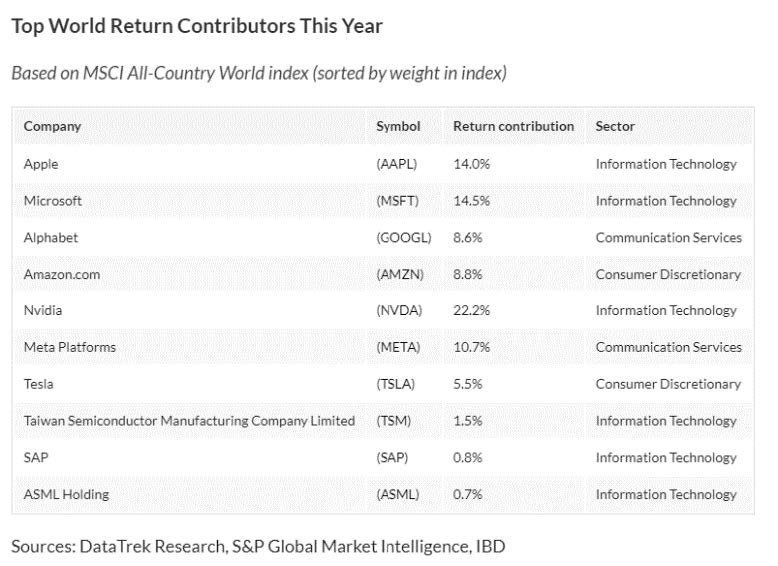
You’ve no doubt heard of the Magnificent Seven stocks driving most S&P 500 gains. But what about the world’s top 10 stocks? It turns out that three foreign stocks, including Taiwan Semiconductors Manufacturing (TSM), SAP (SAP) and AMSL Holdings (ASML) join the Magnificent Seven in accounting for 87% of the world’s stock returns this year, says data from Data Trek Research, S&P Global Market Intelligence and MarketSmith.
This highlights how even globally, just a tiny handful of stocks are driving most returns. “For reference, there are just over 2,300 stocks in the ACWI ETF which tracks this (MSCI All-Country World) index,” said Nicholas Colas of DataTrek.
U.S. Stocks Still Dominate the Globe And S&P 500
Seeing a few stocks outside the U.S. contribute to global returns is interesting. But it important to point out that they’re a fraction of the power of the U.S.’ Magnificent Seven. Taiwan Semi, SAP and ASML all together accounted for 3.1% of global returns. That’s only about a tenth of the contribution made by Nvidia (NVDA), the largest driver of stock values this year, DataTrek found.
That means the Magnificent Seven combined drove 84% of global returns. And that matches with what’s going on in U.S. markets. The Magnificent Seven drove 117.8% of the S&P 500’s total returns this year. In other words, the S&P 500 would be down on the year if not for the seven tech giants, DataTrek found.
Incidentally, these results are not how global markets work long term. “Academic research shows that from 1990 to 2020 just 2.4% of U.S. listed companies generated all the stock market returns for that period,” Colas said.
Power Of AI In S&P 500
The pulling ahead of just a small group of stocks highlights how it’s the promise of AI that’s propping up the S&P 500, Colas says. “The fact that almost all year-to-date global equity returns come from 10 companies with varying but clearly relevant links to Gen AI delivers a disturbing message: the economic payoffs of this novel technology will go to a handful of businesses,” Colas said.
Bottom Line – 0.4% of the stocks in the index have generated 87% of the equity returns year to date globally.
When discussing the performance of the stock market, equity investors often discuss “market breadth” as a gauge of the stock market’s health. Market breadth refers to how many stocks are participating in a given move in an index or on a stock exchange. An index may be rising, yet more than half the stocks in the index are falling because a small number of stocks have such large gains that they drag the whole index higher. In 2023, this was most obvious when comparing the size weighted S & P 500 Index (+26.2%) to the equally weighted S & P 500 Index (+13.7%). Market breadth indicators can reveal this and warn investors that most stocks are not actually performing well, even though the rising index makes it look like most stocks are doing well. While there are a number of market breadth indicators, some looking at short term data – others, looking at long term – we like to look at longer periods of time. One of the indicators we’ve found most useful is looking at the percentage of stocks within the S&P 500 that are outperforming the S&P 500 as a whole. The chart below looks at that calculation for the last 45 years.
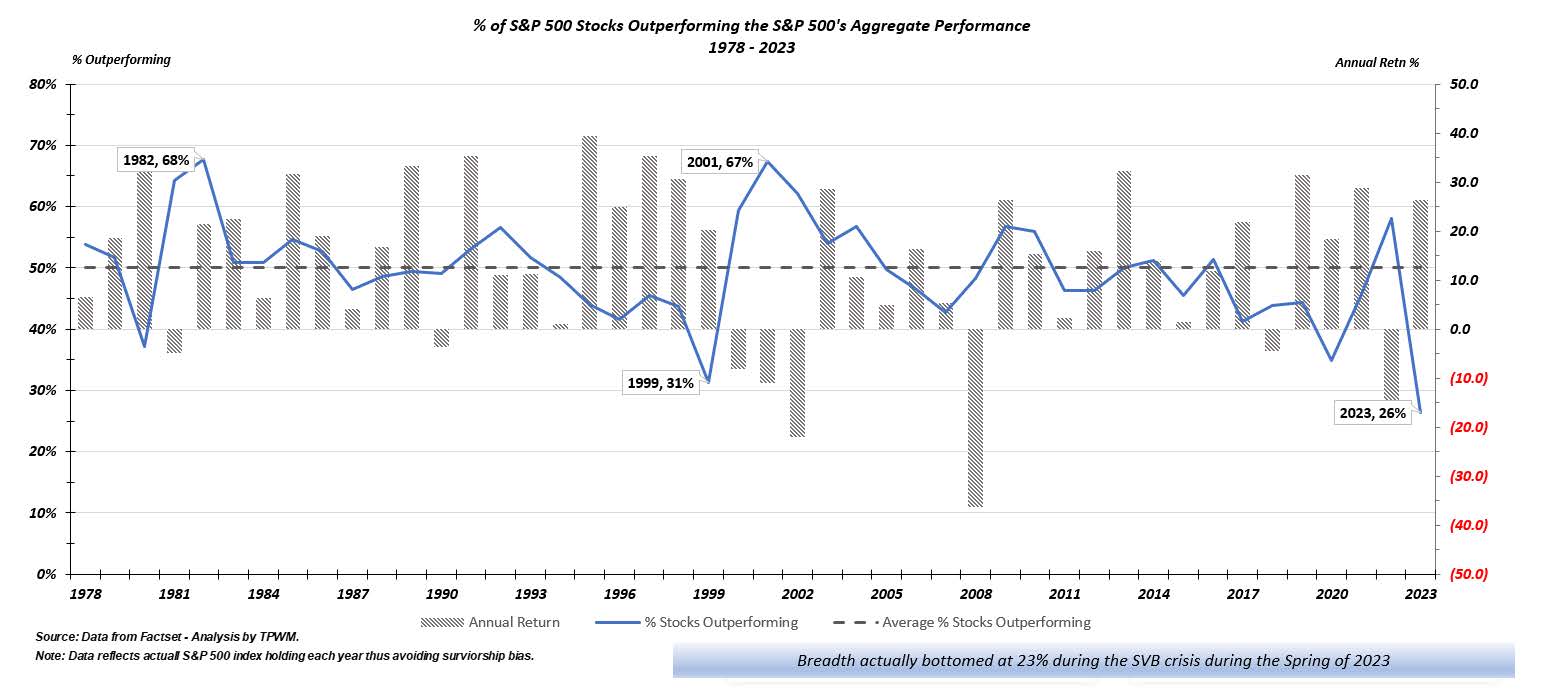
A number of things stand out to us when looking at this chart. 1) While the number bounces around, the average (and median) over the period is 50% – meaning on average 50% of the stocks within the index outperform and 50% underperform the index. 2) There are a couple of notable extremes, 1982 and 2001, as years when a large percentage of stocks within the index outperformed and 1999 and 2023, when the majority of stocks within the index underperformed the index as a whole. 3) Extremes at either end tend to revert to the mean or even swing to the opposite extreme. This analysis, we believe, further supports our expectation that 2023, will prove to be an outlier rather than the start of a new world order and we expect the equity markets to broaden out considerably in 2024. Your portfolios are well positioned to benefit from this return to “normalcy.”
In 2022, the conventional wisdom was that central banks would need to crush their economies in order to crush inflation. Most notably, Larry Summers estimated that the US unemployment rate would either have to rise to 7.5% for two years, 6% for five years, or 10% for one year in order to allow the Fed to bring inflation back down to its 2% target. Summers’ calculation was loosely based on a widely circulated paper he published with Olivier Blanchard and Alex Domash. Their paper’s conclusions rested on two key assumptions: One, that the pandemic had created a structural mismatch of workers, causing the natural rate of unemployment to rise; and two, that it would not be possible to reduce the jobs vacancy rate without simultaneously pushing up unemployment. Both assumptions were considered highly questionable at the time and have since been rendered largely false. The New York Fed’s Multivariate Core Trend model, which captures the underlying trend in Personal Consumption Expenditure inflation (the Fed’s preferred measure of inflation), has fallen almost back to target with no increase in the unemployment rate. Regarding the natural rate of unemployment, while it is true that wage growth began to accelerate when the unemployment rate was still close to 5%, this mainly reflected temporary pandemic distortions. These distortions included extremely generous unemployment and stimulus payments that reduced the incentive to find work, as well as prolonged school closures that made it difficult for parents to work even when they wanted to. Once these distortions abated, the natural rate of unemployment fell back down to pre-pandemic levels.
Ultimately, the key reason that inflation has come down without concurrent weakness in the labor market is that long-term inflation expectations remained well anchored throughout the pandemic and beyond. The Cleveland Fed’s measure of 30-year inflation expectations, which combines survey data with market-based indicators, has fluctuated within a narrow band of 2.3%-to-2.5%. The fact that long-term inflation expectations are well anchored implies that the sacrifice ratio – the amount of economic output that must be forgone to bring down inflation by a given amount – may be quite low. This raises the odds of a soft landing in 2024. In other words, Jay Powell never had to strangle the economy in the way that Paul Volcker had to.
Now that a soft landing appears on the horizon, does that mean we can celebrate? Not quite. There is a big difference between achieving a soft landing and maintaining one. Unless realized inflation continues to decline, inflation expectations will reset to a higher level, undoing all the progress that the Fed has made over the years in anchoring them. Until last month’s FOMC meeting, our bias was to think that the Fed would cut rates too slowly. While the release of the Fed minutes this week poured some cold water on the hope that the Federal Open Market Committee (FOMC) would cut rates as early as March, the minutes did reaffirm the view that the Fed is keen to start cutting rates before the unemployment rate starts rising.
Subjectively, we think the risk that the US economy will begin to overheat again in 2024, has risen versus our previous estimate. The Chicago Fed’s financial conditions index has eased back to where it was in February 2022, when the Fed funds rate was still near zero. The Goldman Sachs financial conditions index is near its loosest level in 18 months. In our minds, the biggest risk to both the equity market and the bond market in the near term is the mismatch in investor expectations as to when the Fed will start to cut interest rates. This is best illustrated by the chart below which compares the FOMC’s individual members expectations for the Fed Funds rate in December of 2024 (red dots) to current investor expectations which are depicted by the dashed green line.
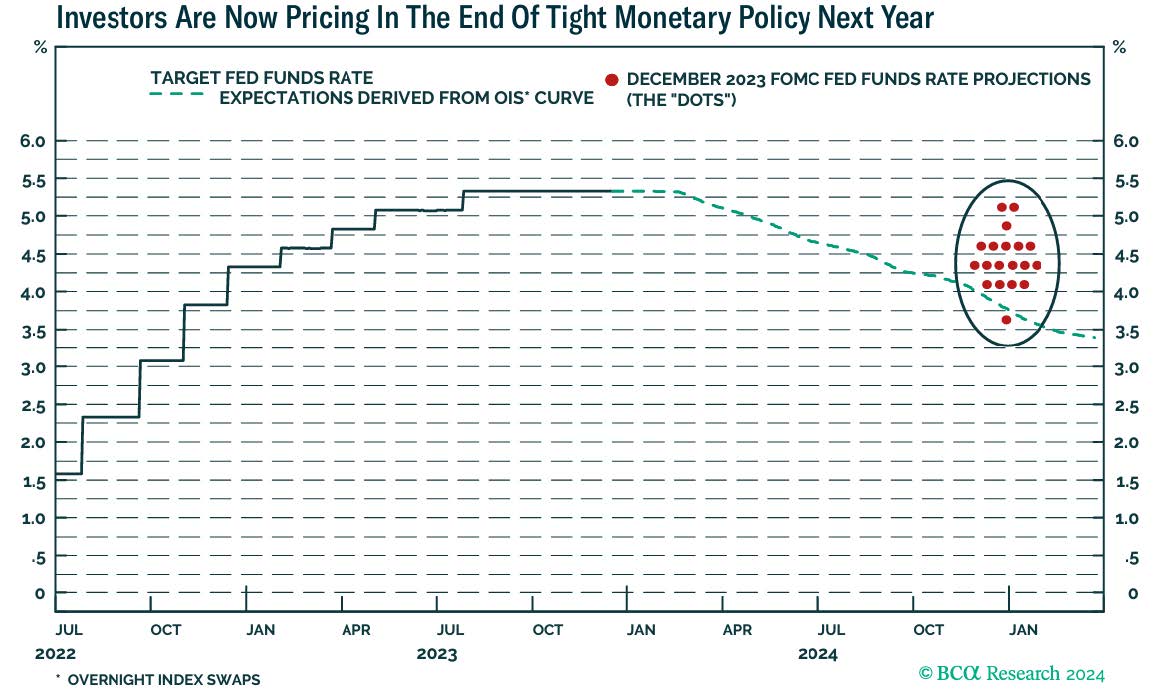
As you can see, every Fed Governor’s estimate (dot) except one, is above to well above investor expectations as to where interest rates will end up in December of 2024.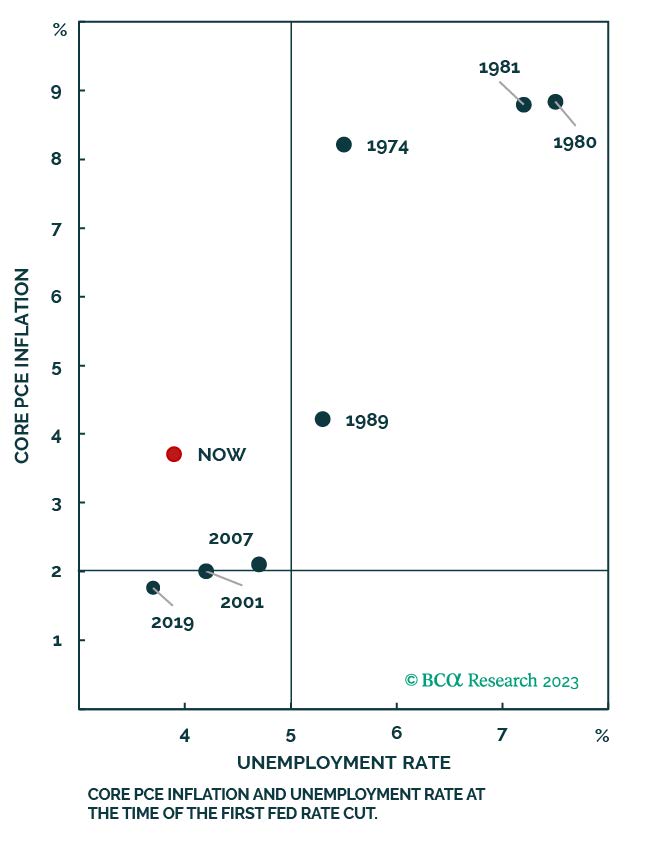
If we look to past Fed behavior as they moved from raising the Fed Fund rate to cutting the Fed Funds rate as a guide, the Fed has never cut when inflation was above 2%, unless unemployment was higher than 5%. We doubt that inflation will fall fast enough for the Fed to ease policy preemptively in the first half of 2024. Your portfolio remains appropriately diversified in light of the above.
We at Twelve Points Wealth hope you and your families are well and hope you have a happy and healthy New Year. Please call or email if you have any questions.
Important Disclosure Information
Please remember that past performance is no guarantee of future results. Different types of investments involve varying degrees of risk, and there can be no assurance that the future performance of any specific investment, investment strategy, or product (including the investments and/or investment strategies recommended or undertaken by Twelve Points Wealth Management (“Twelve Points Wealth”), or any non-investment related content, made reference to directly or indirectly in this commentary will be profitable, equal any corresponding indicated historical performance level(s), be suitable for your portfolio or individual situation, or prove successful. Due to various factors, including changing market conditions and/or applicable laws, the content may no longer be reflective of current opinions or positions. Moreover, you should not assume that any discussion or information contained in this commentary serves as the receipt of, or as a substitute for, personalized investment advice from Twelve Points Wealth. No amount of prior experience or success should not be construed that a certain level of results or satisfaction if Twelve Points Wealth is engaged, or continues to be engaged, to provide investment advisory services. Twelve Points Wealth is neither a law firm, nor a certified public accounting firm, and no portion of the commentary content should be construed as legal or accounting advice. A copy of the Twelve Points Wealth’s current written disclosure Brochure discussing our advisory services and fees continues to remain available upon request or at www.twelvepointswealth.com. Please Remember: If you are a Twelve Points Wealth client, please contact Twelve Points Wealth, in writing, if there are any changes in your personal/financial situation or investment objectives for the purpose of reviewing/evaluating/revising our previous recommendations and/or services, or if you would like to impose, add, or to modify any reasonable restrictions to our investment advisory services. Unless, and until, you notify us, in writing, to the contrary, we shall continue to provide services as we do currently. Please Also Remember to advise us if you have not been receiving account statements (at least quarterly) from the account custodian.
Historical performance results for investment indices, benchmarks, and/or categories have been provided for general informational/comparison purposes only, and generally do not reflect the deduction of transaction and/or custodial charges, the deduction of an investment management fee, nor the impact of taxes, the incurrence of which would have the effect of decreasing historical performance results. It should not be assumed that your Twelve Points Wealth account holdings correspond directly to any comparative indices or categories. Please Also Note: (1) performance results do not reflect the impact of taxes; (2) comparative benchmarks/indices may be more or less volatile than your Twelve Points Wealth accounts; and, (3) a description of each comparative benchmark/index is available upon request.
*Please Note: Ranking Limitations. Neither rankings nor recognitions by unaffiliated rating services, publications, media, or other organizations, nor the achievement of any professional designation, certification, degree, or license, membership in any professional organization, or any amount of prior experience or success, should be construed by a client or prospective client as a guarantee that the client will experience a certain level of results if the investment professional or the investment professional’s firm is engaged, or continues to be engaged, to provide investment advisory services. A fee was not paid by either the investment professional or the investment professional’s firm to receive the ranking. The ranking is based upon specific criteria and methodology (see ranking criteria/methodology). No ranking or recognition should be construed as an endorsement by any past or current client of the investment professional or the investment professional’s firm. ANY QUESTIONS: Twelve Points Wealth’s Chief Compliance Officer remains available to address any questions regarding rankings and/or recognitions, including the criteria used for any reflected ranking.
Disclaimer: Historical data is not a guarantee that any of the events described will occur or that any strategy will be successful. Past performance is not indicative of future results. Returns and data cited above are from various sources including FactSet, Bloomberg, Russell Associates, S&P Dow Jones, MSCI Inc., The St. Louis Federal Reserve, and FactSet, Inc. The content is developed from sources believed to be providing accurate information.
The information in this material is not intended as tax or legal advice. Please consult legal or tax professionals for specific information regarding your individual situation. The opinions expressed and material provided are for general information and should not be considered a solicitation for the purchase or sale of any security. Investing involves risks, including possible loss of principal. Please consider the investment objectives, risks, charges, and expenses of any security carefully before investing.
Twelve Points Wealth Management, LLC is an investment adviser located in Concord, Massachusetts. Twelve Points Wealth Management, LLC is registered with the Securities and Exchange Commission (SEC). Registration of an investment adviser does not imply any specific level of skill or training and does not constitute an endorsement of the firm by the Commission. Twelve Points Wealth Management, LLC only transacts business in states in which it is properly registered or is excluded or exempted from registration