The equity rally continued this quarter with signs of a broadening of participation as the quarter ended. The S & P 500® was up 10.4% during the quarter, the MSCI All-Country World Index® returned 8.2% while the Bloomberg Global Aggregate Bond Index fell by -0.8% as global interest rates modestly increased. US Mega Cap Growth stocks continued to lead – increasing by 10.6% but were joined by Mid Cap stocks which also rose nearly 10%. International Developed (+6%) and Emerging Markets (+2%) were positive but lagged the US. Domestic Short-term Bonds (+0.3%) and Long-term Bonds (-3.7%) showed significant divergence as longer maturity bonds reacted to a change in interest rate expectations among investors driven by somewhat hotter inflation numbers and a reset in the market’s expectations for the number of US interest rate cuts in 2024 by the Fed from seven to three. Despite all the hype associated with Artificial Intelligence (AI), Technology stocks (+8%) lagged Energy stocks (+14%), Industrials (+11%) and Financials (+12%). The lone negative sector this quarter was REITs (-1%) as worries regarding excess office space across the US weighed on sentiment. Precious metals were up, Gold hit an all-time high (+8%) while the broad Commodities indices were up 3-4%. The Global 60/40 portfolio returned 4% for the quarter. All of our risk model portfolios performed in-line with their weighted benchmarks for the quarter.
Revenge of the Real Economy
In several of our previous letters, we’ve discussed the dual mandate of the Federal Reserve – which is to maximize employment and ensure price stability. There are times when these two mandates can come into conflict — 2022 through most of 2023, comes to mind when the Federal Reserve emphasized bringing inflation down at the risk of slowing the economy and increasing unemployment. Chairman Powell alluded to “pain” in August of 2022 – which is the Fed’s euphemism for unemployment as necessary to bring the rate of inflation back down to the Fed’s target of 2.0%. With that as a backdrop, it is hard for stocks to do well (2022) and investors tend to hide in stocks that they feel are immune to an economic slowdown (Mega Cap Growth in 2023). Yet that dual mandate came back into balance in December of 2023 and then shifted again in March of 2024, to prioritizing economic growth over price stability (inflation). In other words, the “Fed Put” is back. The Fed Put is a Wall Street term that refers to the belief that the U.S. Federal Reserve (the Fed) will intervene during crises to support the economy and financial markets. The term comes from the “put option,” which is a contract that allows the holder to sell an asset at a set price within a specified timeframe – in other words, an insurance policy.
In an environment where the Federal Reserve is willing to protect the economy/employment over fighting inflation – investors historically react by increasing their risk tolerance and moving into assets that are more economically sensitive. This tendency was very much on display in late March as stocks outperformed bonds, small cap stocks (Russell 2000, +5%) outperformed Mega Cap Growth (+1%), energy and basic materials stocks were the best performing sectors and gold hit an all-time high.
But for us, the $64,000 question is “Why Now”? There isn’t anything in the aggregate economic demand statistics to give the Fed concern. Below is a summary of the statistics we monitor on this front:
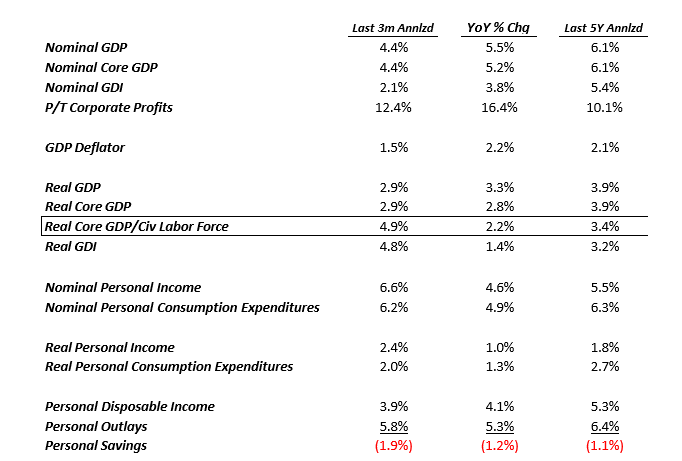
Source: St. Louis Federal Reserve
The current estimate for Real GDP growth from the Atlanta Fed in the first quarter of 2024 is 2.8% as of this writing, certainly in line with recent results. If anything, the US is enjoying somewhat of an economic productivity renaissance much like the mid 1960’s, mid 1980’s and late 1990’s:
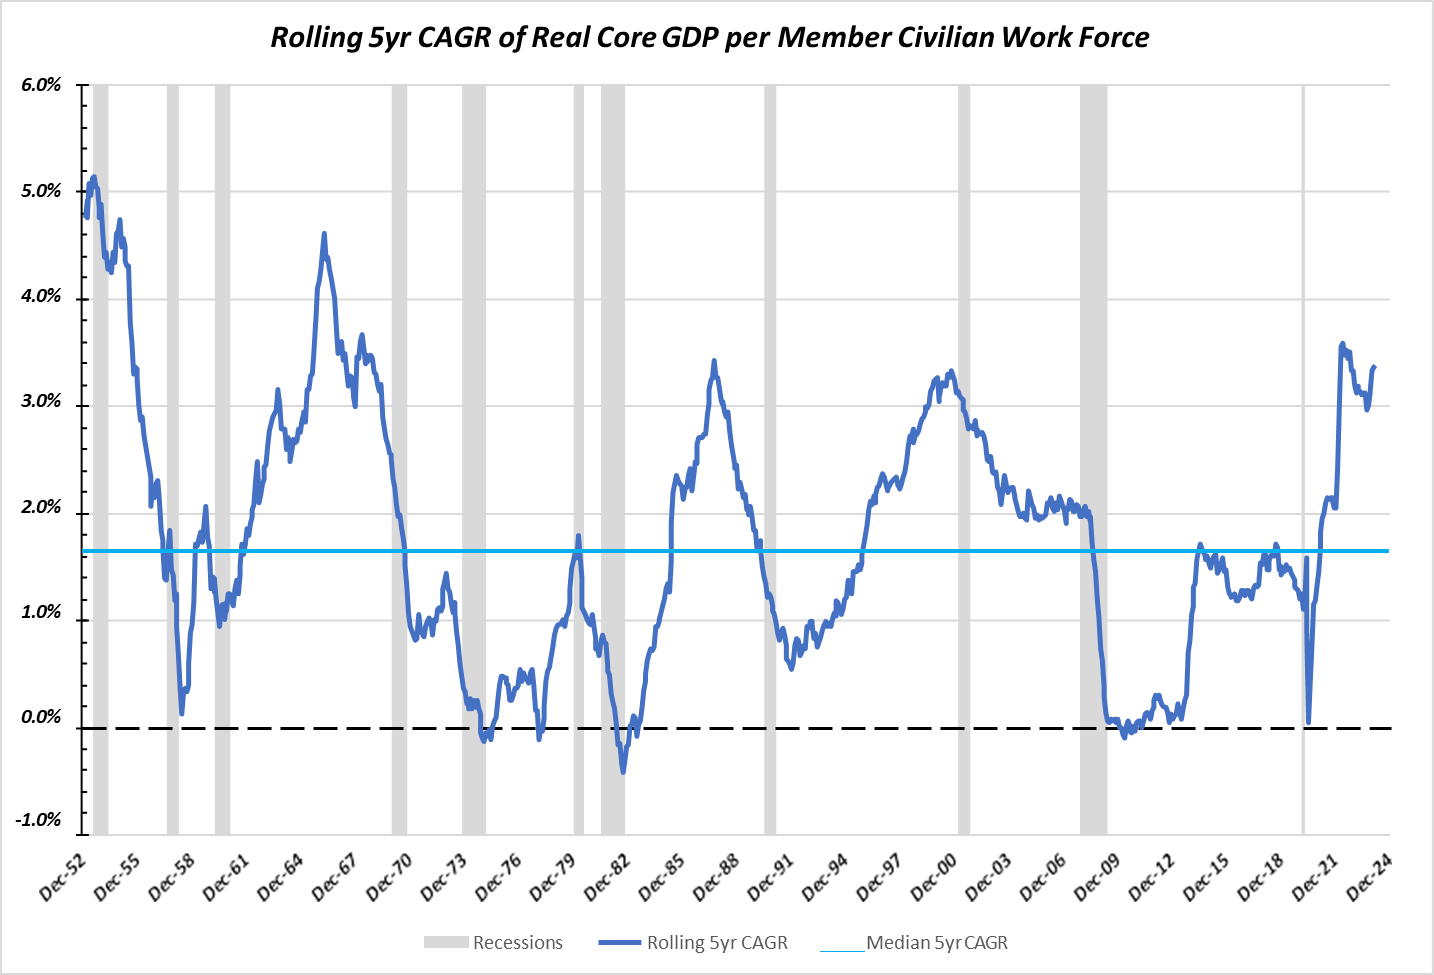 Source: St. Louis Federal Reserve
On the inflation front, there’s no question that progress has stalled with investors now describing the Fed’s change in tolerance as targeting “two point something” instead of 2.0%. That is similarly evident in the numbers we track:
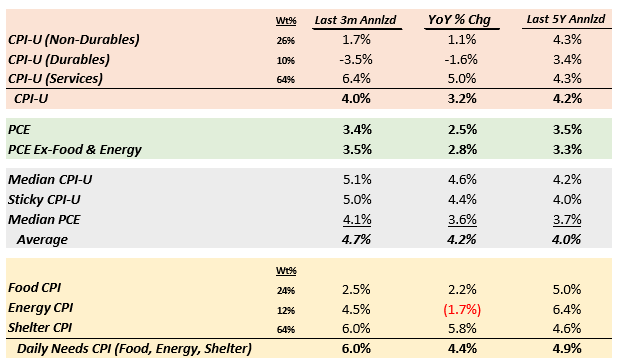 Source: St. Louis Federal Reserve
Even looking at the Fed’s preferred measure of Personal Consumption Expenditures (PCE) ex-Food & Energy, 2.8% year over year is closer to 3.0% than 2.0%. Yet, despite having gone through a 30% rise in the general price level over the last four years – forward inflation expectations remain “well anchored” to use the Fed’s phrasing, in the mid two percent range, looking out over the next 10 years:
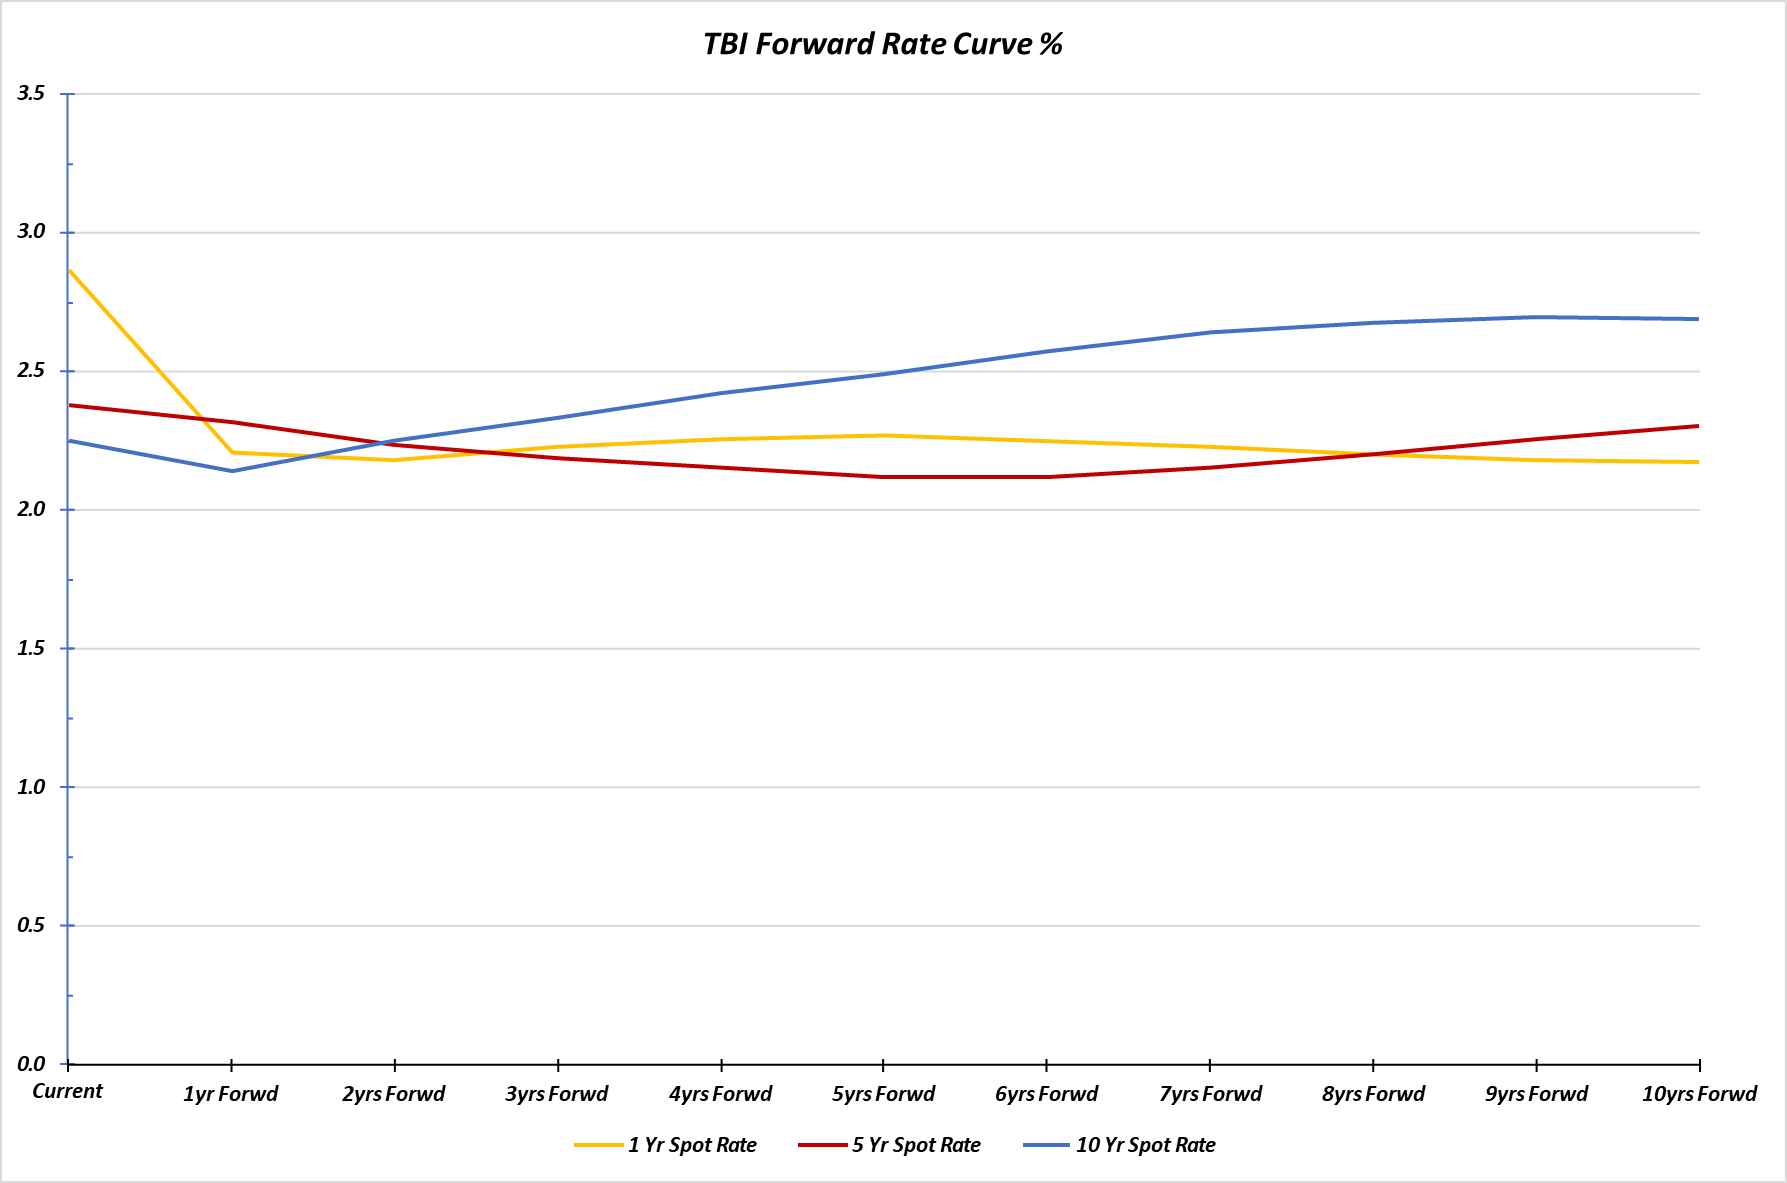
Source: United States Treasury
So that leaves the labor market as the impetus for the Fed’s renewed emphasis on economic growth. The Fed is attempting to come to grips with something this country has not faced in over 50 years – labor demand exceeding labor supply:
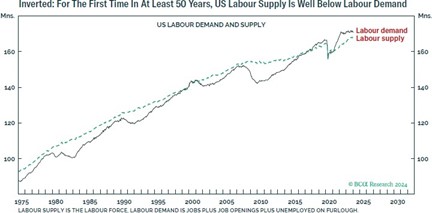
Source: Bank Credit Analyst
This situation was born during the pandemic and although most of the damage has since been repaired, the US economy remains short about 3+ million workers, most of whom took early retirement:
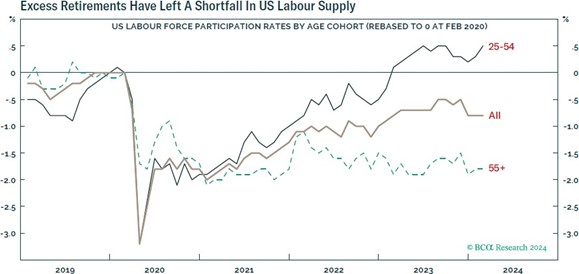
Source: Bank Credit Analyst
Given the strength of the residential real estate and stock markets over the last couple of years, it is highly unlikely that those early retirees will need to return to the workforce in any meaningful numbers. So, the Fed is faced with two choices on how to remedy this situation:
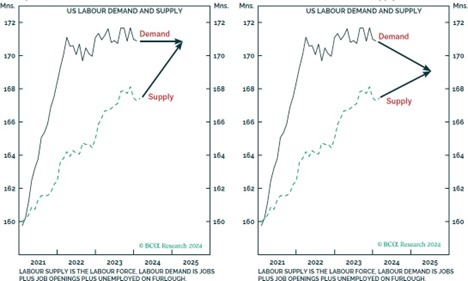
Source: Bank Credit Analyst
The chart on the left depicts the Fed maintaining the economy’s growth around its current level to allow time for demographics and immigration to “fix” the labor shortage problem brought about by the post-pandemic early retirements. The chart on the right is the less desirable solution and the one the Fed was alluding to during the Summer of 2022 – one where a weakening of the economy (aka, a recession) reduced the aggregate demand for workers which would bring labor supply and demand back into balance. The switch in tone out of the Federal Reserve late in 2023, and again after the March 2024 meeting was an explicit acknowledgement that the Fed is now targeting the left chart as the solution.
The bottom line is that, over time, when the Fed is supportive of the economy with liquidity, both the stock and bond markets do well, with a clear bias towards stocks as the level of liquidity support increases. In the chart below, we’ve used the level of unemployment as a proxy for the amount of liquidity support the Fed needed to add to the economy to support economic growth and combat unemployment:
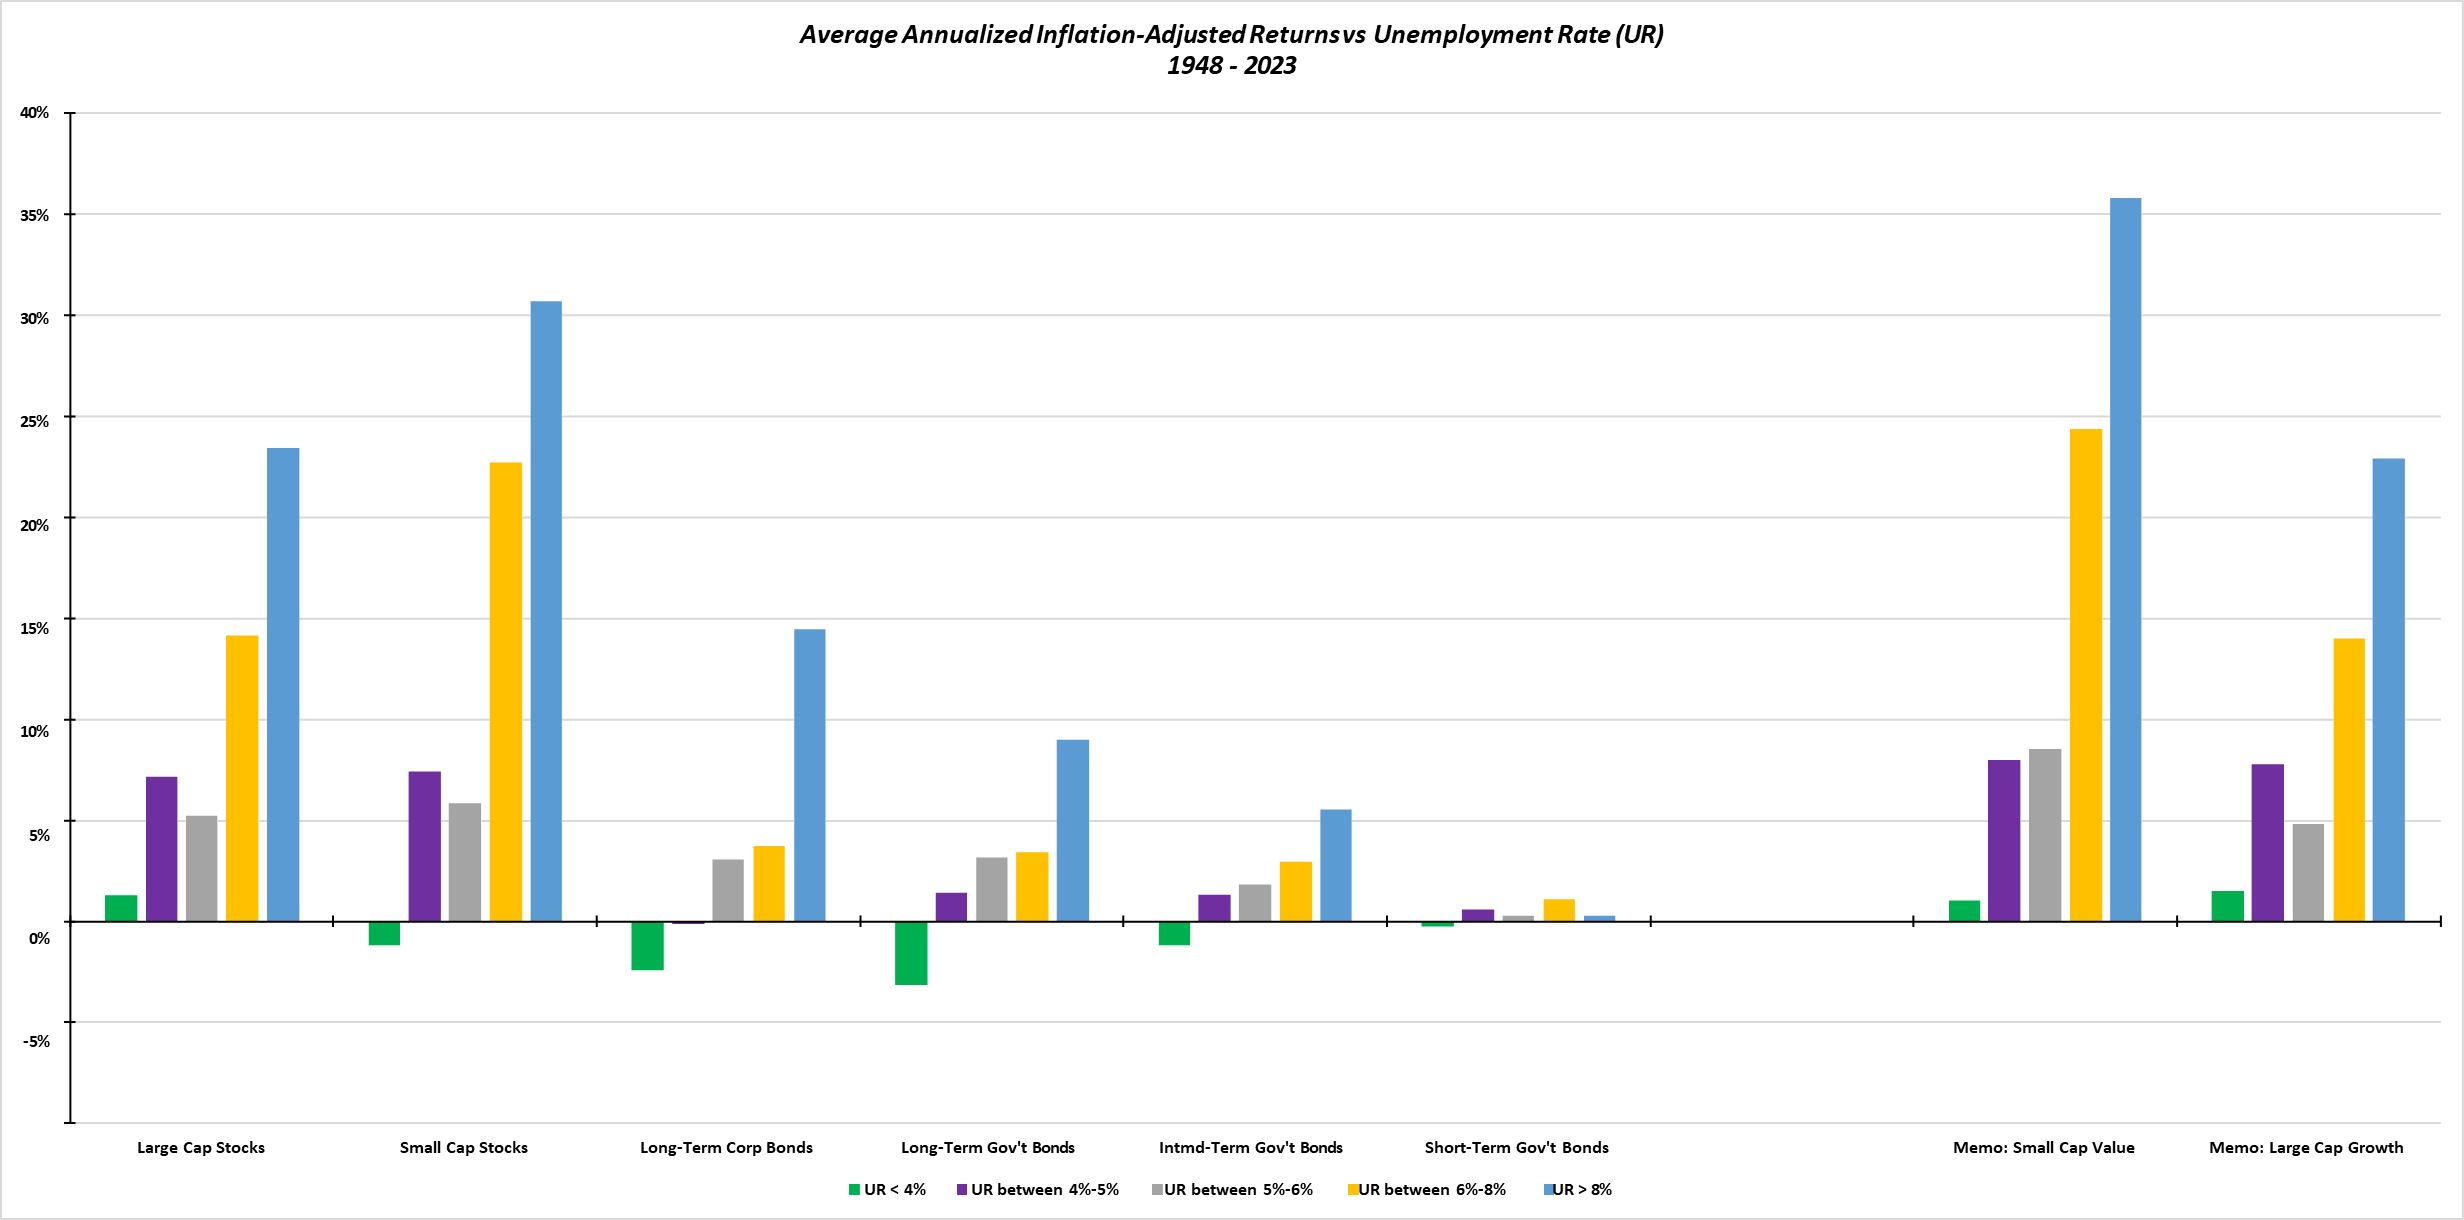
Source: Ibbotson Associates, St. Louis Federal Reserve
Looking at the bars from left to right, this is the “Fed Put” in action – supporting employment and economic activity with liquidity and how that added liquidity impacted both stock and bond markets. Your portfolios are very well positioned to benefit from the above. As the saying goes, “Don’t Fight the Fed.”
We at Twelve Points Wealth hope you and your families are well. Please call or email if you have any questions.
Important Disclosure Information
Please remember that past performance is no guarantee of future results. Different types of investments involve varying degrees of risk, and there can be no assurance that the future performance of any specific investment, investment strategy, or product (including the investments and/or investment strategies recommended or undertaken by Twelve Points Wealth Management (“Twelve Points Wealth”), or any non-investment related content, made reference to directly or indirectly in this commentary will be profitable, equal any corresponding indicated historical performance level(s), be suitable for your portfolio or individual situation, or prove successful. Due to various factors, including changing market conditions and/or applicable laws, the content may no longer be reflective of current opinions or positions. Moreover, you should not assume that any discussion or information contained in this commentary serves as the receipt of, or as a substitute for, personalized investment advice from Twelve Points Wealth. No amount of prior experience or success should not be construed that a certain level of results or satisfaction if Twelve Points Wealth is engaged, or continues to be engaged, to provide investment advisory services. Twelve Points Wealth is neither a law firm, nor a certified public accounting firm, and no portion of the commentary content should be construed as legal or accounting advice. A copy of the Twelve Points Wealth’s current written disclosure Brochure discussing our advisory services and fees continues to remain available upon request or at www.twelvepointswealth.com. Please Remember: If you are a Twelve Points Wealth client, please contact Twelve Points Wealth, in writing, if there are any changes in your personal/financial situation or investment objectives for the purpose of reviewing/evaluating/revising our previous recommendations and/or services, or if you would like to impose, add, or to modify any reasonable restrictions to our investment advisory services. Unless, and until, you notify us, in writing, to the contrary, we shall continue to provide services as we do currently. Please Also Remember to advise us if you have not been receiving account statements (at least quarterly) from the account custodian.
Historical performance results for investment indices, benchmarks, and/or categories have been provided for general informational/comparison purposes only, and generally do not reflect the deduction of transaction and/or custodial charges, the deduction of an investment management fee, nor the impact of taxes, the incurrence of which would have the effect of decreasing historical performance results. It should not be assumed that your Twelve Points Wealth account holdings correspond directly to any comparative indices or categories. Please Also Note: (1) performance results do not reflect the impact of taxes; (2) comparative benchmarks/indices may be more or less volatile than your Twelve Points Wealth accounts; and, (3) a description of each comparative benchmark/index is available upon request.
*Please Note: Ranking Limitations. Neither rankings nor recognitions by unaffiliated rating services, publications, media, or other organizations, nor the achievement of any professional designation, certification, degree, or license, membership in any professional organization, or any amount of prior experience or success, should be construed by a client or prospective client as a guarantee that the client will experience a certain level of results if the investment professional or the investment professional’s firm is engaged, or continues to be engaged, to provide investment advisory services. A fee was not paid by either the investment professional or the investment professional’s firm to receive the ranking. The ranking is based upon specific criteria and methodology (see ranking criteria/methodology). No ranking or recognition should be construed as an endorsement by any past or current client of the investment professional or the investment professional’s firm. ANY QUESTIONS: Twelve Points Wealth’s Chief Compliance Officer remains available to address any questions regarding rankings and/or recognitions, including the criteria used for any reflected ranking.
Disclaimer: Historical data is not a guarantee that any of the events described will occur or that any strategy will be successful. Past performance is not indicative of future results. Returns and data cited above are from various sources including FactSet, Bloomberg, Russell Associates, S&P Dow Jones, MSCI Inc., The St. Louis Federal Reserve, and FactSet, Inc. The content is developed from sources believed to be providing accurate information.
The information in this material is not intended as tax or legal advice. Please consult legal or tax professionals for specific information regarding your individual situation. The opinions expressed and material provided are for general information and should not be considered a solicitation for the purchase or sale of any security. Investing involves risks, including possible loss of principal. Please consider the investment objectives, risks, charges, and expenses of any security carefully before investing.
Twelve Points Wealth Management, LLC is an investment adviser located in Concord, Massachusetts. Twelve Points Wealth Management, LLC is registered with the Securities and Exchange Commission (SEC). Registration of an investment adviser does not imply any specific level of skill or training and does not constitute an endorsement of the firm by the Commission. Twelve Points Wealth Management, LLC only transacts business in states in which it is properly registered or is excluded or exempted from registration.