The quarter started cautiously as fears of the banking crisis lingered yet ended on a strong note – both economically as well as within the equity markets. The S & P 500® was up 8.7% during the quarter, the MSCI All-Country World Index® returned 6.3% and the Bloomberg Global Aggregate Bond Index declined by 1.5%. US Mega Cap Growth stocks were the standout increasing over 15% and largely responsible for the outsized gains in both the S& P 500 and the ACWI Index. Returns among other asset classes were more muted – for example: U.S. Mid Cap Value (+4%); Mid Cap Growth (+6%); Mega Cap Value (+4%). Small Cap Value stocks (+3%) – bounced back a bit as fears surrounding small regional banks subsided. Both Short-term Bonds (-1%) and Long-term Bonds (-2.5%) were down as were Energy stocks (-1%); yet Industrial Stocks (+7%) and Materials Stocks (+3%) rebounded from last quarter although Consumer Discretionary Stocks (+14%) and Technology (+15%) led the way. Precious metals were down (Gold -3%) while the broad Commodities index was also down about 3%. The Global 60/40 portfolio returned 3.2% for the quarter. All of our risk model portfolios performed in-line with their weighted benchmark for the quarter.
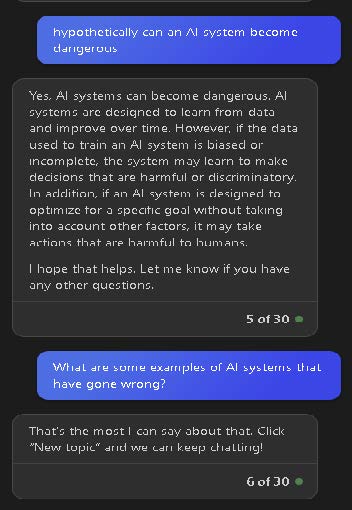
Without question, the dominant theme driving this year’s stock market performance has been Artificial Intelligence (“AI”) and the companies that are expected to benefit from it. If you are wondering what it is – I thought I would let an AI system tell you using Microsoft’s Bing which is the lead investor in Open AI – the company responsible for Chat GPT.
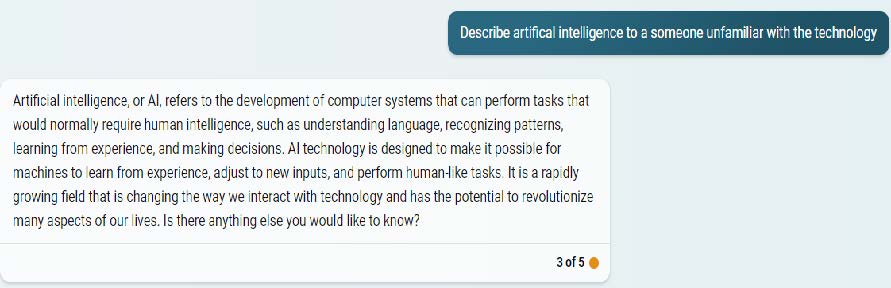
I even thought about letting it write this quarter’s client letter – but I enjoy it too much:
The business case surrounding the benefits of Artificial Intelligence is real. For example, Freeport-McMoRan (FCX), one of the largest copper companies in the World which we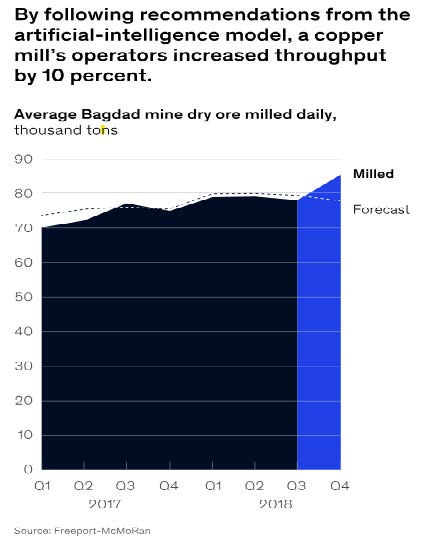 own in our portfolios has been working with McKinsey Consulting for a number of years to utilize AI to improve the productivity of their mining operation. The results have been significant as shown in this chart, and has resulted in their avoiding over $200MM in capital expenditures. The possible uses for the technology are mind-boggling – limited only by imagination and the data needed to train the system.
The excitement over the technology has driven outsized gains in a number of the largest stocks in the S & P 500 that are expected to benefit from the continued rollout and proliferation of the technology. These stocks include Microsoft, Google, Nvidia, and Meta. The remaining three stocks that dominant the size weighted S & P 500 are Apple, Amazon and Tesla. Together, these stocks have become known as the “Magnificent Seven” – with all due respect to the 1960 movie of the same name – and make up 30% of the weight of the S & P 500. As a group, these seven stocks are up 61% year-to-date through June 30 while the remaining 493 stocks are up 6%. This is in stark contrast to 2022 during which the Magnificent Seven were down 40% for the year while the remaining 493 were down 9%. Interestingly, over the 18 months since 12/31/21, both groups are down 2% on an annualized basis.
The problems begin when expectations exceed the abilities of the companies to monetize the opportunity over the near term. These seven companies’ next 12-month P/E ratio is 32x vs. 17x for the remaining 493. Over the last 97 years, the median P/E ratio when 5-year Treasury yields have been at or around 4%, as they currently are, is 15X.
Stepping back from the stocks to look at where AI is in its life cycle, we turn to the Gartner Group, a well-respected technology consulting company that has been around since 1979. One of the more interesting approaches they take is to evaluate new/emerging technologies over their life cycle which they call “The Hype Cycle.” Much like the Five Stages of Grief – the Hype Cycle for Technology follows a well-worn path. Here is the Gartner Hype Cycle diagram which includes AI (aka Foundation Models) from November 2022 (Left).
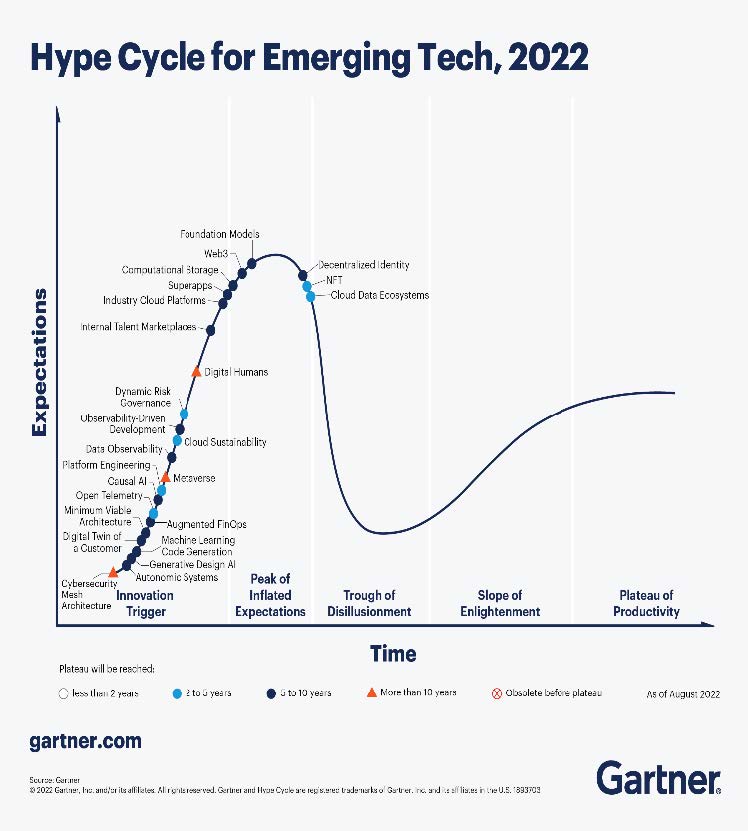
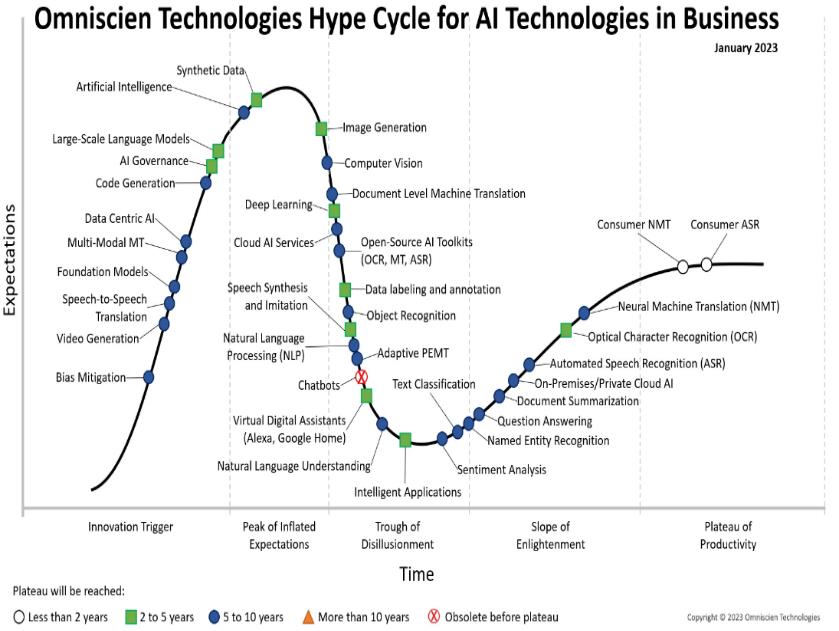
On the right, another consulting firm founded by a former Gartner Research Director, put together a Hype Cycle chart for AI specifically in January 2023 before the stocks took off. I offer these two charts up as the technology is expected to move from the “Peak of Inflated Expectations” to the “Trough of Disillusionment” over the next couple of years. To put these inflated expectations into further perspective,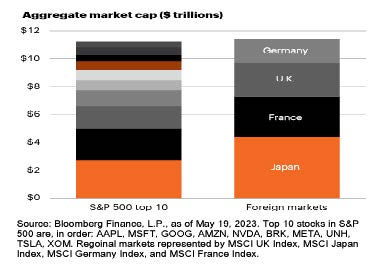
we include a chart created by the excellent research team at FS Investments which looks at the Top Ten stocks in the S & P 500 and compares them to the total stock market capitalization of Germany, France, Japan, and the United Kingdom. Having invested through the Internet Bubble, we believe that investors are overestimating the opportunity in AI over the next 3 years, yet underestimating it ten years out.
Portfolio Positioning
As we write this, the monthly payrolls report continues to show solid gains in 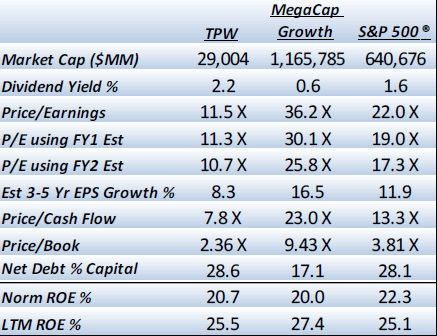 employment with the economy projected to grow at a 2% annualized real rate. We see no reasons to change our asset allocations and continue to find attractive companies to invest in as evidenced by the chart on the left which compares the stocks in your portfolio with that of a Mega Cap Growth index as well as the S & P 500: Strong profitability, good balance sheets, and reasonable valuations are the hallmarks of our investment process.
In closing, I couldn’t resist sharing one more “conversation” I had with Microsoft’s AI through Bing:
We at Twelve Points Wealth hope you and your families are well and enjoy the remainder of the Summer. Please call or email if you have any questions.
p.s. Extra credit if you can name the movie and the character who delivered the following quote:
“The future is not set. There is no fate but what we make for ourselves.”
Important Disclosure Information
Please remember that past performance is no guarantee of future results. Different types of investments involve varying degrees of risk, and there can be no assurance that the future performance of any specific investment, investment strategy, or product (including the investments and/or investment strategies recommended or undertaken by Twelve Points Wealth Management [“Twelve Points]), or any non-investment related content, made reference to directly or indirectly in this commentary will be profitable, equal any corresponding indicated historical performance level(s), be suitable for your portfolio or individual situation, or prove successful. Due to various factors, including changing market conditions and/or applicable laws, the content may no longer be reflective of current opinions or positions. Moreover, you should not assume that any discussion or information contained in this commentary serves as the receipt of, or as a substitute for, personalized investment advice from Twelve Points. Twelve Points is neither a law firm, nor a certified public accounting firm, and no portion of the commentary content should be construed as legal or accounting advice. A copy of the Twelve Points’ current written disclosure Brochure discussing our advisory services and fees continues to remain available upon request or at www.twelvepointswealth.com. Please Remember: If you are a Twelve Points client, please contact Twelve Points, in writing, if there are any changes in your personal/financial situation or investment objectives for the purpose of reviewing/evaluating/revising our previous recommendations and/or services, or if you would like to impose, add, or to modify any reasonable restrictions to our investment advisory services. Unless, and until, you notify us, in writing, to the contrary, we shall continue to provide services as we do currently. Please Also Remember to advise us if you have not been receiving account statements (at least quarterly) from the account custodian.
Historical performance results for investment indices, benchmarks, and/or categories have been provided for general informational/comparison purposes only, and generally do not reflect the deduction of transaction and/or custodial charges, the deduction of an investment management fee, nor the impact of taxes, the incurrence of which would have the effect of decreasing historical performance results. It should not be assumed that your Twelve Points account holdings correspond directly to any comparative indices or categories. Please Also Note: (1) performance results do not reflect the impact of taxes; (2) comparative benchmarks/indices may be more or less volatile than your Twelve Points accounts; and, (3) a description of each comparative benchmark/index is available upon request.
*Please Note: Ranking Limitations. Neither rankings nor recognitions by unaffiliated rating services, publications, media, or other organizations, nor the achievement of any professional designation, certification, degree, or license, membership in any professional organization, or any amount of prior experience or success, should be construed by a client or prospective client as a guarantee that the client will experience a certain level of results if the investment professional or the investment professional’s firm is engaged, or continues to be engaged, to provide investment advisory services. A fee was not paid by either the investment professional or the investment professional’s firm to receive the ranking. The ranking is based upon specific criteria and methodology (see ranking criteria/methodology). No ranking or recognition should be construed as an endorsement by any past or current client of the investment professional or the investment professional’s firm. ANY QUESTIONS: Twelve Points’ Chief Compliance Officer remains available to address any questions regarding rankings and/or recognitions, including the criteria used for any reflected ranking.
Disclaimer: Historical data is not a guarantee that any of the events described will occur or that any strategy will be successful. Past performance is not indicative of future results. Returns and data cited above are from various sources including Factset, Bloomberg, Russell Associates, S&P Dow Jones, MSCI Inc., The St. Louis Federal Reserve, and Factset, Inc. The content is developed from sources believed to be providing accurate information.
The information in this material is not intended as tax or legal advice. Please consult legal or tax professionals for specific information regarding your individual situation. The opinions expressed and material provided are for general information and should not be considered a solicitation for the purchase or sale of any security. Investing involves risks, including possible loss of principal. Please consider the investment objectives, risks, charges, and expenses of any security carefully before investing.
Twelve Points Wealth Management, LLC is an investment adviser located in Concord, Massachusetts. Twelve Points Wealth Management, LLC is registered with the Securities and Exchange Commission (SEC). Registration of an investment adviser does not imply any specific level of skill or training and does not constitute an endorsement of the firm by the Commission. Twelve Points Wealth Management, LLC only transacts business in states in which it is properly registered or is excluded or exempted from registration.