All asset classes declined during the second quarter. The S&P 500 was down over 17% during the quarter. Similarly, the Aggregate Bond Index also was down, declining nearly 5%. Market volatility also caused significant extremes in relative performance: Small Cap Value (-14.6%) vs. Large Cap Growth (-20.7%); Short-term Bonds (-0.5%) vs Long-term Bonds (-12.4%); Utility stocks (-5%) vs Technology Stocks (-21%). Precious metals were down (Gold -7%, Silver -19%) while the broad Commodities index returned a more muted -1%. With geopolitical risk continuing and the global economic picture deteriorating, all markets, to quote our friends at Goldman Sachs, remain “Caught between Inflation Frustration and Recession Obsession.”
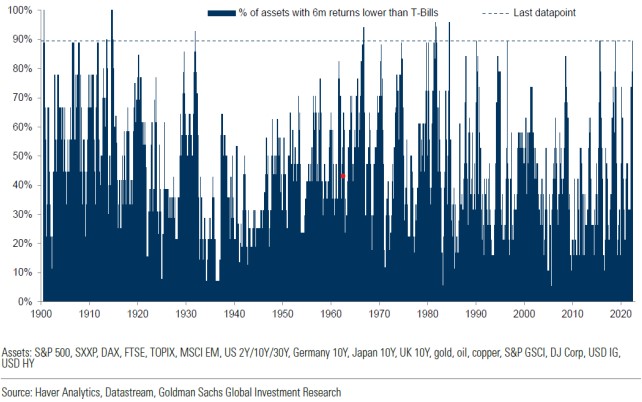
The year to date numbers look equally negative, with nearly all asset classes down 10-20%, except the commodity index which remains up 35%, led by energy. In fact, the last six months has been one of the worst periods in the last 100+ years, as 90% of asset classes have underperformed cash.
While uncertainty remains high, it is clear that TINA (There Is No Alternative) has left the building and TARA (There Are Reasonable Alternatives) has taken up residence. With that as a backdrop, we are pleased to report that, while negative on an absolute basis, all of our risk model portfolios have outperformed their weighted benchmark for both the second quarter as well as the year to date period. By way of example, our Moderate Portfolio (40% Equity/40% Fixed Income/20% Liquid Alternatives) returned -9.6% (net of fees) for the first six months of 2022 while its weighted benchmark returned -14.7%.
As we write this letter, evidence of a meaningful economic slowdown continues to mount. Since the Federal Reserve has just begun its tightening cycle as we discussed previously, the evidence would point to a different source of this weakness, which we believe to be the flip side of the positive wealth effect seen in 2021. According to the St. Louis Federal Reserve, largely because of surging equity and home prices, household wealth increased from $116 trillion at the end of 2019 to $149 trillion at the end of 2021. This implies that over a two-year period, household wealth increased by some $33 trillion, or over 150 percent of GDP. Fast forward to 2022, and we get an entirely different picture as a result of the Fed’s start of an interest rate hiking cycle and a move from one of flooding the market with liquidity to one of withdrawing liquidity at an increasing pace. In the same way as the Fed’s bond buying last year increased market liquidity, the Fed is now withdrawing market liquidity by not rolling over its maturing bond holdings in order to reduce its balance sheet. As we noted at the beginning of this letter, both equity and bond prices have declined by 10-20 percent year to date while exotic markets, like those of cryptocurrency, have declined by some 70 percent. Meanwhile, because of a doubling in mortgage rates from 3 percent at the start of the year to around 6 percent at present, Goldman Sachs is anticipating an early end to the period of rapid home price increases. If sustained, the large decline in financial market prices to date this year, coupled with a prospective leveling off in home prices, could mean that some $15 trillion, or nearly 70 percent of GDP, in household wealth will have evaporated so far in 2022. This amount is a little less than the $18 trillion increase in household wealth created in 2021. This means that the swing from wealth creation last year to wealth destruction this year will have amounted to around 150 percent of GDP. In the past, the Federal Reserve has estimated that a sustained $1 loss in wealth leads to a three- to five-cent decline in aggregate spending (GDP). Even based on the lower bound of those estimates, it would seem that the wealth effect could cause a swing in aggregate demand of around 4.5 percentage points of GDP between last year and this year. The stock market is a discounting mechanism and leads changes in the economy in both directions. As a result, we continue to look for opportunities in high quality companies that have strong balance sheets and superior cash flow generation, which are now very much on sale.
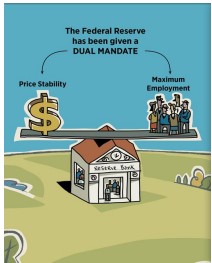
We have and will continue to spill a great deal of digital ink talking about the Federal Reserve because of their huge influence over the world economy and ultimately investment returns – thus, we think it helps to understand what drives this influence. The Federal Reserve System has been given a dual mandate—pursuing the economic goals of both price stability and maximum employment. Price stability means that inflation remains low and stable over the longer run. When inflation is low and stable, people can hold money without having to worry that high inflation will erode its purchasing power. With stable prices, consumers and businesses do not have to worry about rising prices, falling prices when making plans, or when borrowing, or lending for long periods. In short, the economy can run efficiently when inflation is low and stable. The Fed seeks to achieve inflation that averages 2 percent over time as measured by the Personal Consumption Expenditures Price Index ex-Food and Energy (Core PCE). The other part of the Fed’s dual mandate is maximum employment. The concept of maximum employment can be thought of as the highest level of employment that the economy can sustain over time. The level of maximum employment varies over time with business conditions, demographics, labor market regulations, and other factors. Thus, the Fed considers a wide range of employment indicators to estimate the shortfalls of employment from its maximum level. In short, the Fed does not have a numerical target for the level of employment; rather, the Fed analyzes economic conditions using a wide range of data to design policies that achieve maximum employment.
The Fed’s goals of price stability and maximum employment are generally complementary. An economy with low and stable inflation provides economic conditions that are friendly to business planning, saving, and investing, which results in a growing economy. A growing economy needs workers to produce goods and services. Of course, there are times when the goals are not complementary. In the late 1970s and early 1980s, for example, the economy experienced both high inflation and high unemployment (low employment). The Fed decided to reduce the high inflation rate by raising interest rates to very high levels, which contributed to two back-to-back recessions. Over time, inflation returned to a low and stable level, the economy recovered and the unemployment rate fell, which means that employment levels rose toward maximum employment. The misery index, which was developed in the 1970s by Arthur Okun as a proxy to capture the high welfare cost of the high inflation-high unemployment economic environment of the 1970s, is calculated by adding the level of the unemployment rate and the annual inflation rate. At the end of April 2022, we passed the two-year mark from the end of the COVID-19 recession. Given that, we thought it useful to review how this recovery has compared to the prior three economic recoveries which pre-dated the Global Financial Crisis (GFC) of 2008, as well as, the GFC. What stands out is how different inflation and unemployment has behaved in this recovery in comparison to the last four.
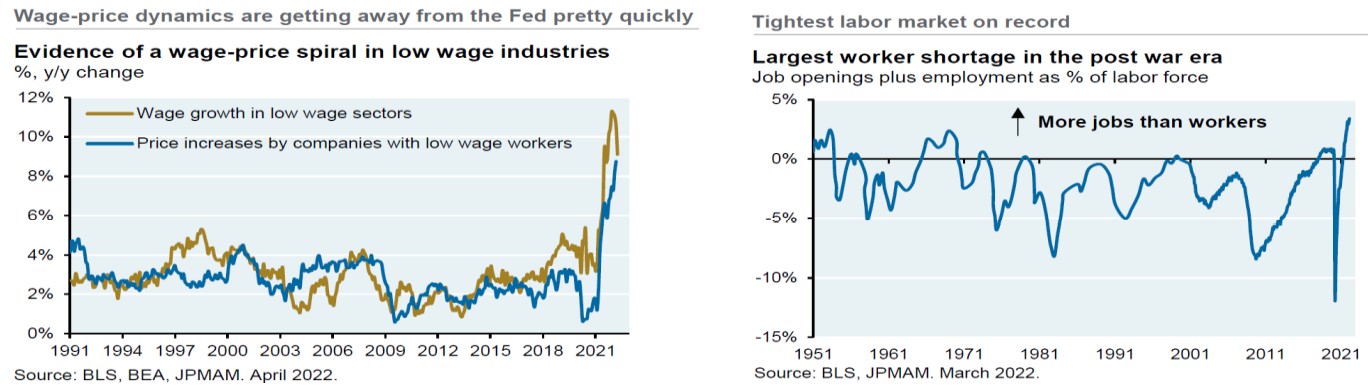
The longest expansion in the postwar period came to an abrupt end in February 2020 with the emergence of the novel coronavirus and the broad implementation of lockdowns across the US. The unemployment rate climbed from its fifty-year low level of 3.5% to 14.7% in a matter of weeks. Despite being the deepest recession, the COVID-19 recession was the briefest downturn in postwar history as the acute disruptions in the macro economy reversed rapidly. Economic activity picked up briskly in 2021: real GDP grew at an annualized rate of 6.9% in the fourth quarter, job openings reached 11 million in December, and the unemployment rate declined back to 3.5% in March 2022. This rapid pickup in economic activity was also accompanied by a steep rise in inflation. In March 2022, CPI inflation rose 8.5% on a year-over-year basis a rate not
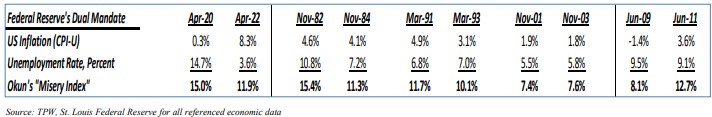
seen in almost 40 years. This brief but deep recession and its brisk recovery has brough t the US economy to unfamiliar territory. Not since the 1960s has the US economy experienced such high levels of price inflation accompanied with such low levels of unemployment. The 1970s, generally referred to as the stagflation period, ended with both the unemployment rate and price inflation reaching double digits. The 1980s, the Volcker disinflation period, was a decade where both inflation and the unemployment rate declined precipitously. These tumultuous decades were followed by three decades of quiescent inflation, despite substantial fluctuations in the unemployment rate. This thirty-year long experience of subdued inflation, seemingly immune to labor market fluctuations, was interpreted as the weakening of the unemployment inflation trade-off, — often referred to as the death of the Phillips curve. The developments of the last two years—the dramatic decline in the unemployment rate and the sharp increases in inflation—have brought discussions of a changing unemployment-inflation trade-off back to the fore. A useful construct to gauge the unemployment-inflation trade-off is the so-called natural rate of unemployment, which is defined as the unemployment rate such that, controlling for supply shocks, inflation remains stable. The natural rate of unemployment is affected both by business-cycle fluctuations and by secular factors. Furthermore, the unemployment-inflation trade-off is linked by the classical determinants of inflation such as inflation expectations. This trade-off can be represented as shown in the graph below.
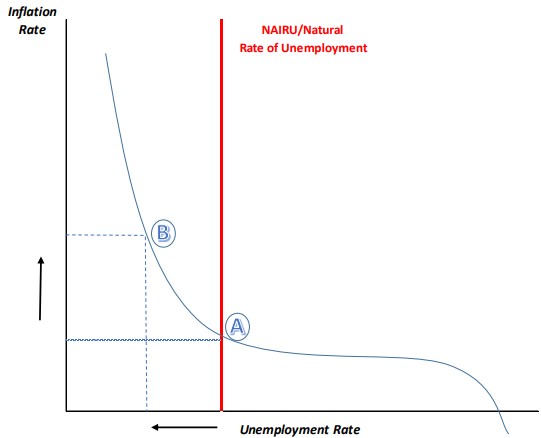
As the economy moves below the natural rate of unemployment, [also known as the Non-Accelerating Inflation Rate of Unemployment (NAIRU) that is a theoretical level of unemployment below which inflation would be expected to rise] from Point A to Point B, inflationary pressures increase. Current estimates show the natural rate of unemployment has risen appreciably since the start of the pandemic, from 4.5% at the end of 2019 to 5.9% at the end of 2021. The behavior of the natural rate of unemployment stands in stark contrast to the secular trend in unemployment which continued its downward drift unabated through the pandemic to 4.2%—its lowest level in 60 years. The last time we observed both the natural rate well above the secular trend along with high inflation was in the 1970s. Another notable similarity between the 1970s and 2022 is the existence of the large negative unemployment gap, the difference between the actual unemployment rate and the natural rate of unemployment (Point B above). In the late 1970s, this gap stood at around -1.5 percentage points and in the first quarter of 2022, the gap expanded to nearly -2.5%. These two factors point to continued inflationary pressures for the US economy.
As we discussed in our previous letter, the Federal Reserve has finally admitted that inflation is a problem and has embarked on a “tightening” cycle, by raising the Federal Funds rate. This is the target interest rate set by the Federal Open Market Committee (FOMC) at which commercial banks borrow and lend their excess reserves to each other overnight – in order to slow economic activity enough to reduce inflationary pressures. The commentary out of the Federal Reserve has been designed to make investors believe that they will continue until inflation is firmly on a path back toward its target of an average of 2.0%. Over the last 30 years, the Fed has used the “Taylor Principle” – invented and published by John Taylor, an economist at Stanford, to help guide where the Federal Funds rate should be to achieve its dual mandate. That is, until this cycle. The Taylor Principle utilizes both the rate of inflation and the level of real economic activity in comparison to its long-run average as inputs to achieve a
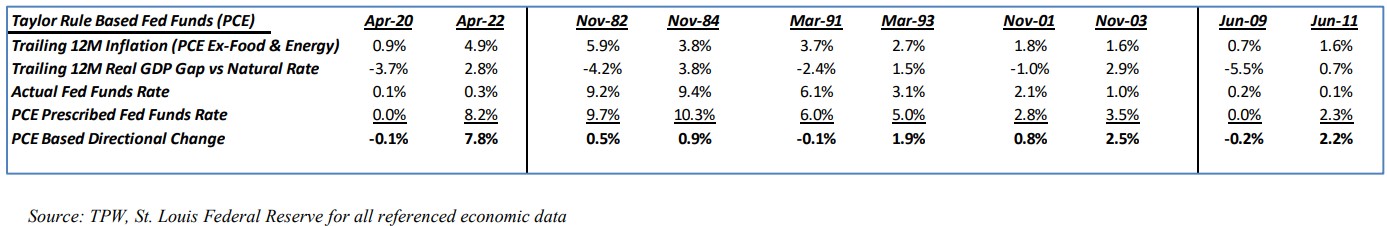
balance. The Fed has ignored this tool during the current recovery and we are all paying the price every day at the supermarket and gas pump. Now we are not delusional enough to believe the Fed will raise the Fed Funds rate to anywhere near 8.0% as implied by the current inputs – we simply put this information forth as an indication of how far behind the curve they are and how distorted the fixed income markets are as a result.
Unfortunately, the short end of the fixed income market is not the only part of the yield curve that is distorted. The expansion of the Fed’s balance sheet over the last 14 years, through Quantitative Easing (QE), has resulted in the Fed owning nearly 40% of all US Treasury bonds outstanding with maturities between 10 and 30 years. The result of this “excess” demand for long-term Treasuries has resulted in the long end of the interest rate curve being overvalued (i.e. yields too low) given long-term inflation expectations. While the table below shows “snapshots” in time, there remains a historical consistency between the Actual/Prescribed Federal Funds rate and the Fair Value
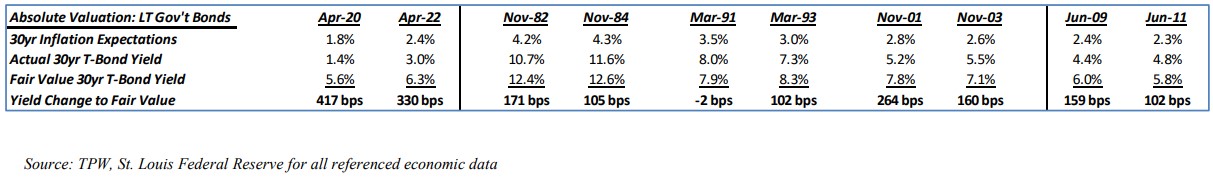
yield on the 30-year Treasury bond – that is, except for currently, where the yield change to fair value for the 30yr bond is 2-3X what it was in prior recoveries. The above analysis continues to drive our thinking regarding the fixed income side of your portfolios and we see no need to make any changes at this time.
We at Twelve Points Wealth hope you and your families are well and enjoy your summer. Please call or email if you have any questions.
![]()
Steve Bruno, CFA
Chief Investment Officer
July 1, 2022
Disclaimer: Historical data is not a guarantee that any of the events described will occur or that any strategy will be successful.
Past performance is not indicative of future results. Returns and data cited above are from various sources including Factset, Bloomberg, Russell Associates, S&P Dow Jones, MSCI Inc., The St. Louis Federal Reserve and Factset, Inc. The content is developed from sources believed to be providing accurate information.
The information in this material is not intended as tax or legal advice. Please consult legal or tax professionals for specific information regarding your individual situation. The opinions expressed and material provided are for general information and should not be considered a solicitation for the purchase or sale of any security. Investing involves risks, including possible loss of principal. Please consider the investment objectives, risks, charges, and expenses of any security carefully before investing.
Twelve Points Wealth Management, LLC is an investment adviser located in Concord, Massachusetts. Twelve Points Wealth Management, LLC is registered with the Securities and Exchange Commission (SEC). Registration of an investment adviser does not imply any specific level of skill or training and does not constitute an endorsement of the firm by the Commission. Twelve Points Wealth Management, LLC only transacts business in states in which it is properly registered or is excluded or exempted from registration.