Another quarter, another record high. The S & P 500® was up 5.8% during the quarter, the MSCI All-Country World Index® returned 6.4% and the Bloomberg Global Aggregate Bond Index rose by 7.0% as US Federal Reserve lowered the target Federal Funds rate for the first time in four years at their September meeting by 50 bps, citing a reduction in the rate of inflation, as well as, a softening in the labor market. US Mega Cap Growth stocks rose by a more tepid 2.6% while the equally weighted S & P 500 index rose by 9.5% and the S & P 600 Small Cap Index rose by 10.1%, as the market finally began to broaden out beyond the “Magnificent Seven.” Returns among other asset classes outside Mega Cap Growth diverged as well. For example: U.S. Mid Cap Value (+6.4%); Mid Cap Growth (-0.9%); Mega Cap Value (+9.1%). Short-term Bonds (+2.9%) and Long-term Bonds (+7.9%) also showed significant divergence as longer maturity bonds, being more sensitive to changes in interest rates, had a greater reaction to a reduction in global interest rates (ex-Japan). Energy (-2.9%) was the worst performing sector this quarter as the price of oil fell with investors concerned over a global growth slowdown. There was greater uniformity in performance among sectors as the most interest rate sensitive sectors led the performance parade: Financials (+10.6%); Industrial Stocks (+11.5%); Basic Material Stocks (+9.6%); Consumer Discretionary Stocks (+10.1%); Technology (0.0%); REITs (+17.1%); Consumer Staples (+9.0%); Healthcare (+6.1%); and Utilities which were up (+19.3%). Precious metals were up (Gold +13%) while the broad Commodities indices were flat. The Global 60/40 portfolio returned +6.7% for the quarter reflecting the broad strength outside of the US Mega Cap growth stocks. All of our risk model portfolios performed in-line with their weighted benchmarks for the quarter.
With less than a month to go, we thought reviewing the current state of the U.S. election, focusing on the final stretch leading up to Election Day, would be appropriate:
Election Timeline and Early Voting
- Election Day: November 5th, with many Americans voting earlier.
- Early Voting: In key swing states like North Carolina, Pennsylvania, Arizona, Georgia, Nevada, Wisconsin, and Michigan between September 16th and October 26th.
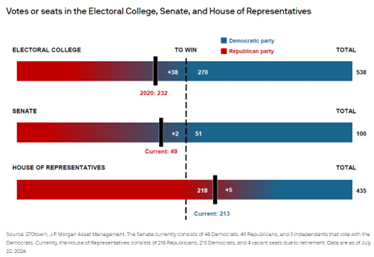
Current State of the Race
- Vice President Kamala Harris: In a better position than President Biden was months ago, but the race remains highly competitive.
- Former President Trump: Holds a slight electoral advantage and is perceived as better for the economy. RFK’s endorsement of Trump may influence key swing states.
Key Advantages and Disadvantages
- Trump: Slight electoral edge, economic perception, and RFK’s endorsement.
- Harris: Out-fundraising Trump, better ground infrastructure, polling ahead nationally and in many states, higher enthusiasm, and support from female voters.
Potential Catalysts
Polling Data (as of October 13)
- Arizona: Trump +1.0 (RealClearPolitics), Trump +1.8 (FiveThirtyEight)
- Georgia: Trump +0.5 (RealClearPolitics), Trump +0.9 (FiveThirtyEight)
- Michigan: Trump +0.9 (RealClearPolitics), Harris +0.8 (FiveThirtyEight)
- Nevada: Trump +0.2 (RealClearPolitics), Harris +0.5 (FiveThirtyEight)
- Pennsylvania: Trump +0.1 (RealClearPolitics), Harris +0.7 (FiveThirtyEight)
- Wisconsin: Harris +0.3 (RealClearPolitics), Harris +0.6 (FiveThirtyEight)
Key Policy Issues for Markets
- Taxes: Potential changes to the 2017 Tax Cuts and Jobs Act (TCJA), with different approaches from Trump and Harris.
- Trade: Bipartisan support for a tough stance on China, with varying approaches.
- Market Implications: Historical data shows election years tend to be good for U.S. stocks, with some volatility leading up to the election.
Federal Finances and Deficit
- Deficit: $1.7 trillion in 2023, $1.8 trillion estimated for 2024, projected to remain high over the next decade.
- Interest Payments: Net interest payments on debt are increasing due to higher rates.
Stock Market Returns and Volatility
- Historical Performance: Election years generally see positive returns, with some volatility.
- Market Timing: Risky strategy around elections, with potential for quick rebounds.
Investing in an Election Year
- Political Opinions: Should not overrule investment decisions.
- Returns Under Different Governments: Historical data shows varied performance, with macro conditions being more influential than political configurations.
Recent Developments
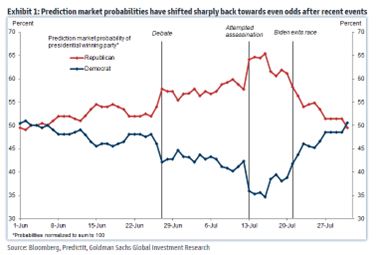
- Biden’s Exit: Shifted market perceptions, with betting odds now closer to even between Republican and Democratic outcomes.
- Market Reactions: Generally, a Trump win is associated with higher yields, a stronger USD, and higher equity prices.
Conclusion
- Close Race: The election remains highly competitive, with both candidates having distinct advantages.
- Market Impacts: Likely to be modest, with macro conditions playing a significant role.
The 2024 U.S. presidential election features significant policy differences between Vice President Kamala Harris and former President Donald Trump. Here’s a detailed comparison of their key policies and the potential investment implications:
Tax Policies
- Kamala Harris:
- Corporate Tax: Plans to raise the top corporate tax rate to 28% from 21%.
- Individual Tax: Proposes raising income tax rates to pre-2018 levels for individuals earning more than $400,000 by letting the 2017 Tax Cuts and Jobs Act (TCJA) expire.
- Investment Implications: Higher corporate taxes could impact corporate profits, potentially leading to lower stock prices. Increased individual taxes on high earners might reduce disposable income and consumer spending, affecting sectors reliant on discretionary spending.
- Donald Trump:
- Corporate Tax: Aims to reduce the corporate tax rate to 15%-20% from 21%.
- Individual Tax: Wants to permanently extend the tax rates established in the TCJA.
- Investment Implications: Lower corporate taxes could boost corporate profits and stock prices. Extending individual tax cuts might increase disposable income, potentially boosting consumer spending and benefiting sectors like retail and consumer goods.
Trade Policies
- Kamala Harris:
- China: Plans to employ targeted tariffs on Chinese technology products and other geopolitical rivals.
- Investment Implications: Targeted tariffs could lead to increased costs for companies reliant on Chinese imports, potentially affecting profit margins. However, it might also benefit domestic industries by reducing competition from Chinese products.
- Donald Trump:
- China: Proposes a 60% tariff on all goods from China.
- Investment Implications: Broad tariffs could significantly increase costs for U.S. companies importing from China, potentially leading to higher consumer prices and reduced corporate profits. This could negatively impact sectors like technology and manufacturing that rely heavily on Chinese imports.
Regulatory Differences
- Kamala Harris:
- Minimum Wage: Plans to raise the federal minimum wage to $15/hour from $7.25.
- Student Debt Relief: Proposes expanding student debt relief.
- Antitrust Initiatives: Plans to expand antitrust enforcement.
- Investment Implications: Higher minimum wages could increase labor costs for businesses, potentially impacting profit margins, especially in labor-intensive industries like retail and hospitality. Expanded student debt relief might increase disposable income for younger consumers, benefiting sectors like housing and consumer goods. Increased antitrust enforcement could lead to more scrutiny and potential breakups of large corporations, particularly in the tech sector.
- Donald Trump:
- Regulation: Plans to cut regulations substantially across the board, reduce barriers, and shorten approval times for mergers and acquisitions.
- Investment Implications: Reduced regulations could lower compliance costs for businesses, potentially boosting profits. Easier merger and acquisition processes might lead to increased consolidation in various industries, potentially benefiting sectors like banks, healthcare and technology.
Foreign Policy
- Kamala Harris:
- Continuity with Biden Administration: Focus on strategic sector protection, deepening relationships with allies, and addressing climate change.
- Investment Implications: Continued focus on sectors like AI, quantum computing, and biotech could benefit companies in these industries. Support for climate initiatives might boost investments in renewable energy and green technologies.
- Donald Trump:
- Hardline Stance: Likely to take a tougher stance on foreign policy, particularly with China, and increase control on outbound investment and data.
- Investment Implications: A hardline stance could lead to increased geopolitical tensions, potentially impacting global trade and investment flows. Sectors like defense and cybersecurity might benefit from increased government spending and focus.
Market Implications
- Kamala Harris:
- General Outlook: Policies might lead to increased government spending on social programs and infrastructure, potentially boosting economic growth but also increasing the deficit.
- Investment Implications: Sectors like healthcare, education, and renewable energy might see increased investment and growth opportunities.
- Donald Trump:
- General Outlook: Policies might focus on deregulation and tax cuts, potentially boosting corporate profits and stock market performance but also increasing income inequality.
- Investment Implications: Sectors like energy, financial services, and manufacturing might benefit from reduced regulations and lower taxes.
Conclusion
The policy differences between Harris and Trump present distinct investment implications each with potential impacts on various sectors and the broader economy. It is essential to take a long-term view and avoid making investment decisions based solely on political outcomes.
Historically, the stock market has shown interesting trends during U.S. presidential election years.
Here are some key points:
Average Performance
- Overall Gains: On average, stocks have risen by about 11.6% during presidential election years since 1926, which is slightly better than the market’s average return of 10.3% in all years.
- Positive Years: Out of the 23 election years since the S&P 500 Index began, 19 years (83%) have provided positive performance.
Performance by Party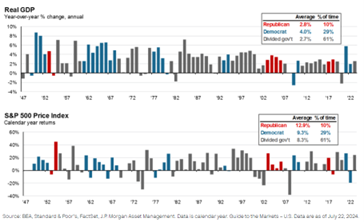
- The charts below highlight real GDP growth and S&P 500 returns during Republican (red), Democratic (blue), and divided governments (when one party does not control the White House and both chambers of Congress). Since 1947, real GDP has grown on average 2.8% under Republican rule and 4.0% under Democratic rule. The S&P 500 has returned 12.9% under Republicans and 9.3% under Democrats.
- It would be easy to conclude that the economy performs better under Democrats and the market performs better under Republicans, but the sample sizes are relatively small. Republicans have controlled the government only 11% of the time since World War II, in the mid-1950s, early 2000s, and just before the pandemic. These were significantly disparate macro environments. Democrats have controlled the government 29% of the time, mostly in the post-WWII period and in the 1960s, but only in six years over the past three decades. Instead, the most common configuration of government is divided, which has produced 2.7% annualized real GDP growth since World War II, and 8.3% annualized returns on the S&P 500.
Election Cycle Theory
- Presidential Election Cycle Theory: This theory suggests that the stock market tends to perform differently in each year of a presidential term. Typically, the third year is the strongest for the market, followed by the fourth year, then the second, and finally the first3.
Recent Trends
- Obama and Trump Presidencies: During Obama’s terms, the first two years were more profitable than the third. For Trump, the first year was more profitable than the second, followed by a major surge in the third year.
Volatility and Market Timing
- Volatility: Election years tend to be more volatile, especially in the lead-up to the election. However, after Election Day, markets often stabilize as uncertainty is removed.
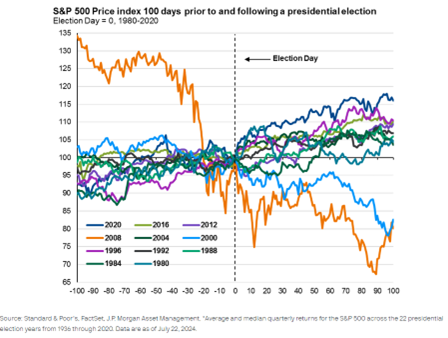
- Market Timing: Attempting to time the market around elections can be risky. Historical data shows that markets often rebound quickly after elections, making it difficult for investors to re-enter the market in time to benefit from these rebounds.
Notable Exceptions
- 2008 and 2020: These years saw significant economic shocks that bucked the usual election year trends. In 2008, the market dropped by 37% due to the financial crisis, and in 2020, the COVID-19 pandemic caused significant volatility.
Conclusion
While historical data shows that election years tend to be positive for the stock market, various factors, including economic conditions and unexpected events, can influence performance. Investors should be cautious about making investment decisions based solely on election year trends. Investors always want to know how markets performed under different configurations of government or different years of a presidency. How do markets perform under a Republican sweep or Democrat sweep? What if a Republican wins the White House but loses both chambers of Congress? How do returns look in the first year of a presidency? This information is easy to compute, as highlighted below, but these returns tell investors very little about why markets performed the way they did and how markets are likely to perform in the future. Monetary policy, fiscal policy, economic growth, labor markets, corporate profits, and valuations are much better indications of future returns. Fiscal policy is driven by the government of course, but the configuration of the government matters and a sweep by one party doesn’t guarantee that it will accomplish all its campaign promises. In fact, due to growing political polarization, garnering consensus within a party is becoming increasingly difficult. For example, while the Democrats controlled Congress, President Biden had an ambitious Build Back Better proposal, which was later scaled down to a more moderate Inflation Reduction Act as a compromise between members of his own party. Furthermore, just as calendar years are arbitrary markers when considering economic and market cycles, they also seldom align with actions of presidential administrations.
The economic context, not the political context, tends to be much more relevant to understanding historical market environments and returns. Political opinions are best expressed at the polls, not in a portfolio. One cardinal rule investors ought to follow: Don’t let how you feel about politics overrule how you think about investing. Investors who allowed their political opinions to overrule their investing discipline may have missed out on above-average returns during political administrations they didn’t like.
Food for Thought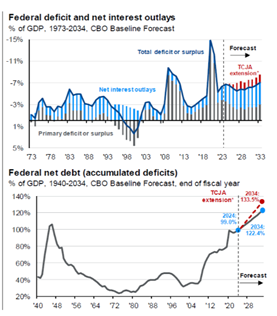
While not a huge issue this election cycle, we can’t help but wonder if that changes in 2028. The federal budget deficit was $1.7 trillion in 2023, or 6.3% of GDP, exceeding the 50-year average of 3.7%. This includes a $333 billion deficit reduction in fiscal year 2023 from student debt forgiveness that increased the deficit in 2022 but was later struck down by the Supreme Court in June 2023. Without this accounting adjustment, the budget deficit would have exceeded $2 trillion or 7.5% of GDP. This compares to a deficit of $1.4 trillion in 2022, or 5.4% of GDP, which does include the outlay for student loan forgiveness that was never spent. Prior to the pandemic, the deficit did not exceed $1 trillion and the deficit as a share of GDP was 3.8% in 2018 and 4.6% in 2019. Looking ahead, the Congressional Budget Office projects that deficits will be 5-7% annually over the next decade. This is likely to send U.S. debt to GDP well above 100% over the next decade. Not only is the deficit historically high, but new borrowing is being financed at much higher rates after the Federal Reserve raised policy rates by 5.25%. Therefore, net interest payments on outstanding debt will be a large contributor to the deficit going forward. Net interest payments reached $659 billion in 2023, up from $413 billion in 2021 before the Federal Reserve began hiking rates. While the political solutions are clear – raising taxes and cutting spending – the political will to do either will be limited. A Democratic president may be willing to let the 2017 tax cuts sunset at least partially at the end of 2025 but may expand spending. A Republican president may look to cut spending, but would likely extend the 2017 tax cuts, and perhaps propose new tax cuts. Of course, a president’s ability to pass any proposals into law would depend on the makeup of Congress. However, the net effect of either of these paths is unlikely to reduce the deficit from the trajectory it is on.
We at Twelve Points Wealth hope you and your families are well and hope you have a happy and healthy upcoming Holiday Season. Please call or email if you have any questions.

P.S. As follow up to last quarter’s letter we wrote in early July on the psychological aspects of FoMO or the Fear of Missing Out, we would like to update you on Super Micro Computer (SMCI) which we used as our example to illustrate: “The fear of missing out on investment opportunities, fueled by social media and the desire to not be left out, can lead to impulsive and emotionally driven investment decisions, potentially resulting in losses.” During the third quarter, the company was the subject of SEC investigation for potential accounting irregularities which resulted in their inability to file their financial statements (10-K) for the year ending June 30, 2024. I would note two things: 1) the company had a similar problem in August of 2017; 2) insiders at the company were selling shares between April and June of 2024 (red arrows). Below is a stock price chart for the last six months (note: they split the stock 10 for 1 on Oct 1st, so the prices do not align with our quarterly letter) which shows the stock down by over 50% since early July. This example highlights the potential dangers of investing without disciplined research.
 Source: Factset
Important Disclosure Information
Please remember that past performance is no guarantee of future results. Different types of investments involve varying degrees of risk, and there can be no assurance that the future performance of any specific investment, investment strategy, or product (including the investments and/or investment strategies recommended or undertaken by Twelve Points Wealth Management (“Twelve Points Wealth”), or any non-investment related content, made reference to directly or indirectly in this commentary will be profitable, equal any corresponding indicated historical performance level(s), be suitable for your portfolio or individual situation, or prove successful. Due to various factors, including changing market conditions and/or applicable laws, the content may no longer be reflective of current opinions or positions. Moreover, you should not assume that any discussion or information contained in this commentary serves as the receipt of, or as a substitute for, personalized investment advice from Twelve Points Wealth. No amount of prior experience or success should not be construed that a certain level of results or satisfaction if Twelve Points Wealth is engaged, or continues to be engaged, to provide investment advisory services. Twelve Points Wealth is neither a law firm, nor a certified public accounting firm, and no portion of the commentary content should be construed as legal or accounting advice. A copy of the Twelve Points Wealth’s current written disclosure Brochure discussing our advisory services and fees continues to remain available upon request or at www.twelvepointswealth.com. Please Remember: If you are a Twelve Points Wealth client, please contact Twelve Points Wealth, in writing, if there are any changes in your personal/financial situation or investment objectives for the purpose of reviewing/evaluating/revising our previous recommendations and/or services, or if you would like to impose, add, or to modify any reasonable restrictions to our investment advisory services. Unless, and until, you notify us, in writing, to the contrary, we shall continue to provide services as we do currently. Please Also Remember to advise us if you have not been receiving account statements (at least quarterly) from the account custodian.
Historical performance results for investment indices, benchmarks, and/or categories have been provided for general informational/comparison purposes only, and generally do not reflect the deduction of transaction and/or custodial charges, the deduction of an investment management fee, nor the impact of taxes, the incurrence of which would have the effect of decreasing historical performance results. It should not be assumed that your Twelve Points Wealth account holdings correspond directly to any comparative indices or categories. Please Also Note: (1) performance results do not reflect the impact of taxes; (2) comparative benchmarks/indices may be more or less volatile than your Twelve Points Wealth accounts; and, (3) a description of each comparative benchmark/index is available upon request.
*Please Note: Ranking Limitations. Neither rankings nor recognitions by unaffiliated rating services, publications, media, or other organizations, nor the achievement of any professional designation, certification, degree, or license, membership in any professional organization, or any amount of prior experience or success, should be construed by a client or prospective client as a guarantee that the client will experience a certain level of results if the investment professional or the investment professional’s firm is engaged, or continues to be engaged, to provide investment advisory services. A fee was not paid by either the investment professional or the investment professional’s firm to receive the ranking. The ranking is based upon specific criteria and methodology (see ranking criteria/methodology). No ranking or recognition should be construed as an endorsement by any past or current client of the investment professional or the investment professional’s firm. ANY QUESTIONS: Twelve Points Wealth’s Chief Compliance Officer remains available to address any questions regarding rankings and/or recognitions, including the criteria used for any reflected ranking.
Disclaimer: Historical data is not a guarantee that any of the events described will occur or that any strategy will be successful. Past performance is not indicative of future results. Returns and data cited above are from various sources including FactSet, Bloomberg, Russell Associates, S&P Dow Jones, MSCI Inc., The St. Louis Federal Reserve, and FactSet, Inc. The content is developed from sources believed to be providing accurate information.
The information in this material is not intended as tax or legal advice. Please consult legal or tax professionals for specific information regarding your individual situation. The opinions expressed and material provided are for general information and should not be considered a solicitation for the purchase or sale of any security. Investing involves risks, including possible loss of principal. Please consider the investment objectives, risks, charges, and expenses of any security carefully before investing.
Twelve Points Wealth Management, LLC is an investment adviser located in Concord, Massachusetts. Twelve Points Wealth Management, LLC is registered with the Securities and Exchange Commission (SEC). Registration of an investment adviser does not imply any specific level of skill or training and does not constitute an endorsement of the firm by the Commission. Twelve Points Wealth Management, LLC only transacts business in states in which it is properly registered or is excluded or exempted from registration.