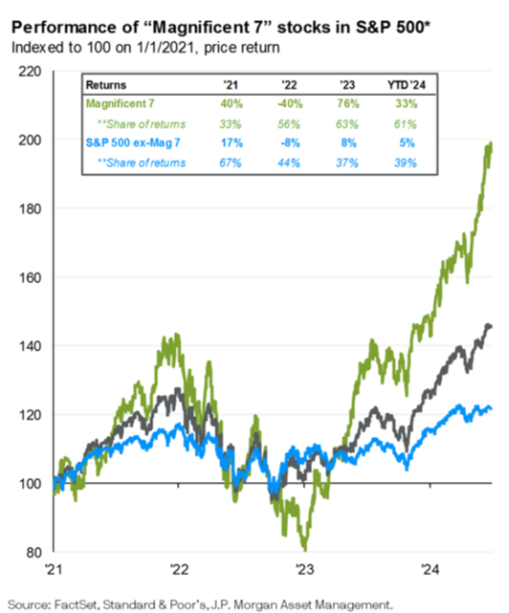
The quarter started with a modest pullback in April but ended with a record rally that enabled the equity market to reach multiple new highs in June. The S & P 500® was up 3.9% during the quarter, the MSCI All-Country World Index® returned 2.9% and the Bloomberg Global Aggregate Bond Index declined by 1.1% as global interest rates rose. US Mega Cap Growth stocks rose by 9.6% while the equally weighted S & P 500 index declined by 2.6% and the S & P 600 Small Cap Index fell by 3.5%, further highlighting the extreme performance divergence by the seven largest companies in the US (aka, The Magnificent Seven) and everything else. Returns among other asset classes outside Mega Cap Growth were clustered as well. For example: U.S. Mid Cap Value (-3.4%); Mid Cap Growth (-3.2%); Mega Cap Value (-1.5%) and Small Cap Value stocks (-3.7%). Short-term Bonds (+0.8%) and Long-term Bonds (-2.0%) showed significant divergence as longer maturity bonds reacted to a backup in global interest rates. Basic Materials (-5.0%) was the worst performing sector this quarter as investors grew concerned over a global growth slowdown. There was further divergence in performance among sectors: Financials (-2.4%); Industrial Stocks (-3.3%); Energy Stocks (-3.5%); Consumer Discretionary Stocks (-1.0%); Technology (+9.0%); REITs (-2.8%); Consumer Staples (+0.3%); Healthcare (-1.3%); and Utilities which were up (+3.8%). Precious metals were up (Gold +5%; Silver +17%) while the broad Commodities indices were up 2.0%. The Global 60/40 portfolio returned +1.3% for the quarter reflecting the strength of the US Mega Cap growth stocks which dominate the weighted index. All of our risk model portfolios performed below their weighted benchmarks for the quarter. Below are various charts that further illustrate the extremes of relative performance this year and what concerns us most right now:
Many of you know that Twelve Points considers financial literacy and education a core part of our mission. The Fear of Missing Out, or FoMO, is a psychological phenomenon that has become increasingly prevalent in the last couple of decades, particularly with the rise of social media. Fear of Missing Out is a unique term introduced in 2004 and then extensively used since 2010 to describe a phenomenon observed on social networking sites. In fact, it eventually made it to the Oxford Dictionary. In 20131, British psychologists elaborated and defined it as “pervasive apprehension that others might be having rewarding experiences from which one is absent”, FoMO is characterized by the desire to stay continually connected with what others are doing. Today, more than ever, people are exposed to a lot of details about what others are doing; and people are faced with the continuous uncertainty about whether they are doing enough or if they are where they should be in terms of their life. It’s also interesting to note that FoMO is a global phenomenon, with research evidence present from North America, Asia, Europe and Australia which further underscores the need to understand the problem.
The Fear of Missing Out significantly influences decision-making in various aspects of life. It can lead to feelings of dissatisfaction, anxiety, restlessness, or sadness. These emotions can spur individuals to make impulsive or ill-considered decisions. In the context of financial decisions, the sensation of missing out may lead to risky behaviors, such as making hasty investments or spending beyond one’s means. This is particularly dangerous when it comes to managing finances. For example, seventy-nine percent of respondents in the millennial and Gen Z generations reported using social media to get financial advice, according to a poll commissioned by Forbes Adviser and carried out by market research firm Prolific. The survey also found that 76% of respondents think social media’s financial content has made it less taboo to talk about money, while 62% feel more confident by having access to financial advice. The great majority of millennials and Gen Zers found financial advice on social media with about 7 out of 10 respondents (69%) saying they come across financial advice on social media at least once a week, and a quarter do so daily. Millennials prefer Reddit, while Gen Zers choose YouTube. Just 31% of millennials and Gen Z respondents said they often verify the credentials of those who offer financial advice on social media. Several financial topics are covered on social media platforms, including advice on stock and bond investing (the most popular topic, according to study respondents, at 57%), suggestions around debt reduction, and advice for retirement savings. Get-rich-quick scams (11%) and borrowing money (7%) were the two least discussed issues among individuals polled. However, 28% of respondents claimed to have lost money as a direct result of financial advice they received on social media, while 50% claimed to have gained money as a result. Despite the cautions of financial experts, 78% of those polled felt they have more access to financial advice now than they would have in earlier generations because of their identity, such as their ethnicity, gender, or income. Here is an example of the investment advice found on Reddit – SMCI is Super Micro Computers Inc (a well-known Artificial Intelligence (AI) company):


In the context of financial decision making, the implications of FoMO goes well beyond social anxiety, extending to missing out on rewarding experiences and can lead to high-risk decision-making, potential financial losses, and suboptimal outcomes. The fear of missing out on investment opportunities, fueled by social media and the desire to not be left out, can lead to impulsive and emotionally driven investment decisions, potentially resulting in losses. FoMO as used in behavioral finance and herd behavior from human psychology are related. Both focus on the influence of social pressures and group dynamics on decision making. But they are different. While herd behavior in finance refers to the tendency of individual investors to mimic the investment behavior of what they believe other investors are doing rather relying on their own analysis and research, FoMO is a broader psychological anxiety where an investor is concerned about foregoing potentially return enhancing opportunities that other investors are taking advantage of.
An informational cascade² occurs when it is optimal for an individual, having observed the actions of those ahead of them, to follow the behavior of the preceding individual without regard to their own information3. There are numerous examples of this phenomenon in financial markets:
- In the market for corporate control, the arrival of a first takeover bid frequently attracts competing bids, despite the fact that competition drives up the price.
- The decision of investors to subscribe to an initial public offering (IPO) in which if sufficiently many (few) individuals sign up early to receive shares, all (no) subsequent individuals follow their lead (one of the first questions institutional investors ask is if the offering is “oversubscribed” before agreeing to subscribe).
- If one creditor refuses to renegotiate debt with a distressed firm, others may Similarly, the start of a bank run can be viewed as a cascade in which small depositors fear for the solvency of a bank and act by observing the withdrawal behavior of other depositors.
- It has frequently been argued that market stock price movements are caused by waves of investor sentiment that at the extreme lead to bubbles or crashes.
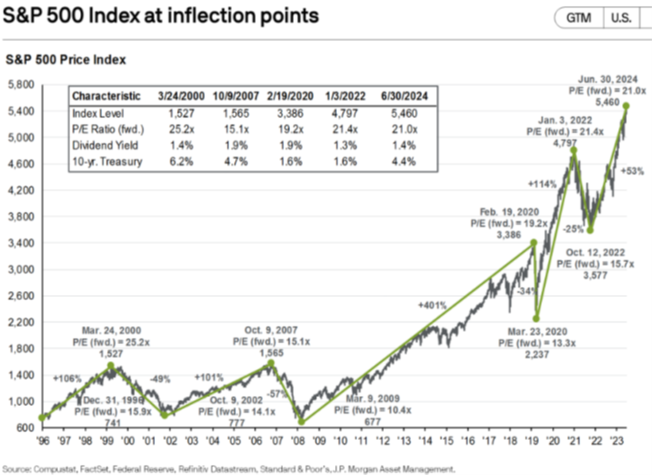
To further illustrate this principle, people often recall the early 1970s when institutional investors were infatuated by the Nifty Fifty—a small group of “one-decision” stocks, companies so appealing that their stocks should always be bought and never sold, regardless of price. Each was a leader in its field with strong balance sheets, high profit margins, and double-digit growth rates. But is such a company’s stock worth any price, no matter how high? In late 1972, Xerox traded for 49 times earnings, Avon for 65 times earnings, Polaroid for 91 times earnings. When the stock market crashed in 1973, the Nifty Fifty defied gravity for a while, held up by institutional investor enthusiasm that created a two-tiered market of the richly priced Nifty Fifty and the depressed rest. Then, in the memorable words of a Forbes columnist, “the Nifty Fifty were taken out and shot one by one.” From their 1972–1973 highs to their 1974 lows, Xerox fell 71%, Avon 86%, and Polaroid 91%. A fundamental investment maxim is that, “A great company is not necessarily a great stock.” No matter how good or bad a company’s management, no matter how large or small a company’s profits, no matter how bright or bleak a company’s prospects, the attractiveness of acompany’s stock depends on its price. At some price, a great company’s stock is expensive; at some price, a lousy company’s stock is cheap.
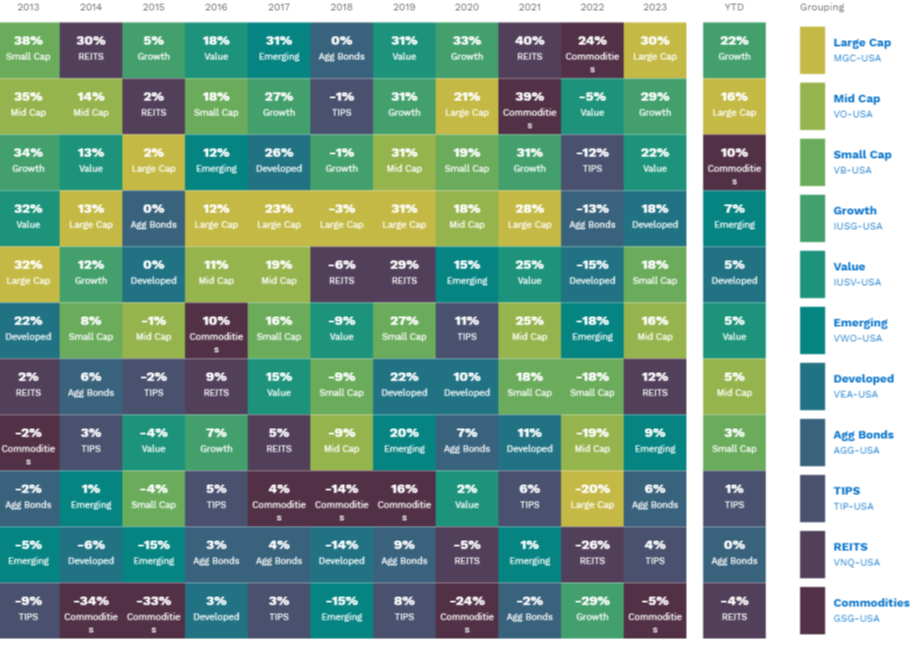
This same phenomenon can impact entire asset classes as well. The chart below is commonly known as a “Quilt” chart in the investment business and it depicts the yearly returns of different asset classes, from large cap growth stocks; to emerging markets, bonds, REITs and commodities. The way the colored boxes move around over the years highlights how last year’s winners can become next year’s losers and vice- versa:
 Source: Factset
Jumping into emerging markets at the end of 2017 or REITs at the end of 2021 resulted in significant drawdowns the following years. Conversely, shunning emerging markets at the end of 2008 or commodities at the end of 2020, resulted in missing out on sizeable gains. In fact, if we compare Investor A who bought last year’s best performing asset class each year over the last 20 years to Investor B who bought last year’s worst performing asset class each year over the last 20 years, Investor B would have outperformed investor A by over 600bps annualized (6%) over that time. The Quilt chart above illustrates why our approach to investing focuses on creating diversified portfolios, across global asset classes, in order to prudently preserve and grow our client’s wealth over time.
We at Twelve Points Wealth hope you and your families are well and hope you have a happy and healthy summer. Please call or email if you have any questions.
P.S. “Those who cannot remember the past are condemned to repeat it.” – George Santayana, The Life of Reason, 1905
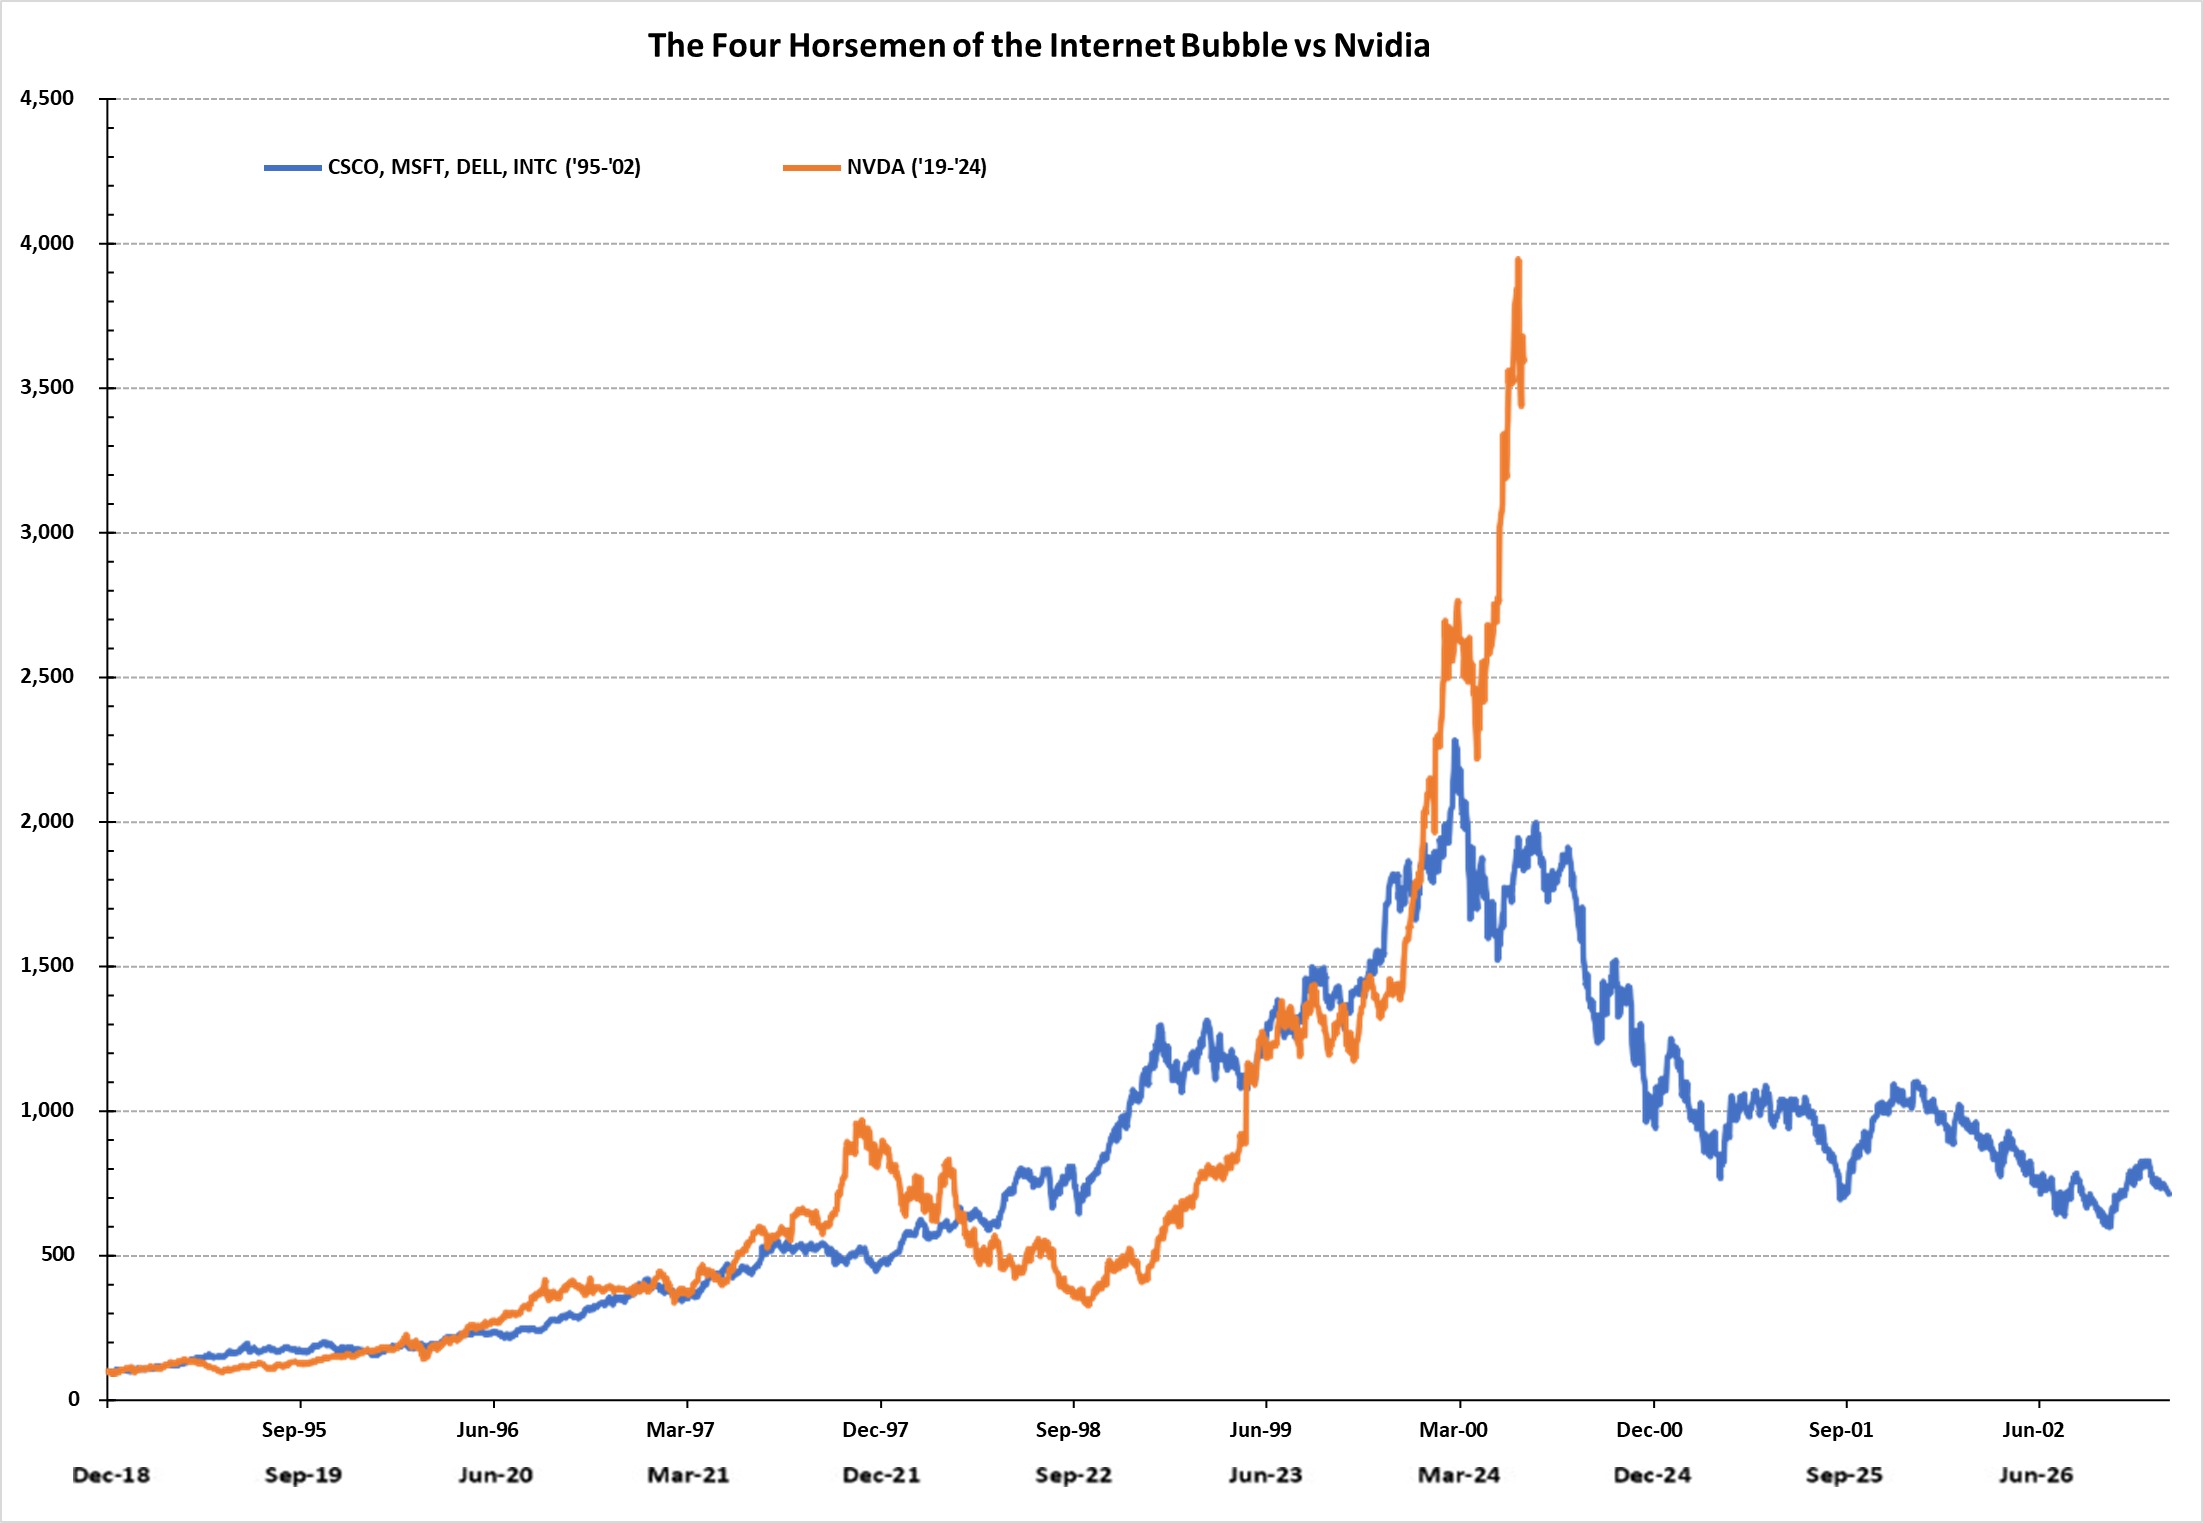
Source: Factset. (Price Index =100, Dec 1994 and Dec 2018 respectively.
Important Disclosure Information
Please remember that past performance is no guarantee of future results. Different types of investments involve varying degrees of risk, and there can be no assurance that the future performance of any specific investment, investment strategy, or product (including the investments and/or investment strategies recommended or undertaken by Twelve Points Wealth Management (“Twelve Points Wealth”), or any non-investment related content, made reference to directly or indirectly in this commentary will be profitable, equal any corresponding indicated historical performance level(s), be suitable for your portfolio or individual situation, or prove successful. Due to various factors, including changing market conditions and/or applicable laws, the content may no longer be reflective of current opinions or positions. Moreover, you should not assume that any discussion or information contained in this commentary serves as the receipt of, or as a substitute for, personalized investment advice from Twelve Points Wealth. No amount of prior experience or success should not be construed that a certain level of results or satisfaction if Twelve Points Wealth is engaged, or continues to be engaged, to provide investment advisory services. Twelve Points Wealth is neither a law firm, nor a certified public accounting firm, and no portion of the commentary content should be construed as legal or accounting advice. A copy of the Twelve Points Wealth’s current written disclosure Brochure discussing our advisory services and fees continues to remain available upon request or at www.twelvepointswealth.com. Please Remember: If you are a Twelve Points Wealth client, please contact Twelve Points Wealth, in writing, if there are any changes in your personal/financial situation or investment objectives for the purpose of reviewing/evaluating/revising our previous recommendations and/or services, or if you would like to impose, add, or to modify any reasonable restrictions to our investment advisory services. Unless, and until, you notify us, in writing, to the contrary, we shall continue to provide services as we do currently. Please Also Remember to advise us if you have not been receiving account statements (at least quarterly) from the account custodian.
Historical performance results for investment indices, benchmarks, and/or categories have been provided for general informational/comparison purposes only, and generally do not reflect the deduction of transaction and/or custodial charges, the deduction of an investment management fee, nor the impact of taxes, the incurrence of which would have the effect of decreasing historical performance results. It should not be assumed that your Twelve Points Wealth account holdings correspond directly to any comparative indices or categories. Please Also Note: (1) performance results do not reflect the impact of taxes; (2) comparative benchmarks/indices may be more or less volatile than your Twelve Points Wealth accounts; and, (3) a description of each comparative benchmark/index is available upon request.
*Please Note: Ranking Limitations. Neither rankings nor recognitions by unaffiliated rating services, publications, media, or other organizations, nor the achievement of any professional designation, certification, degree, or license, membership in any professional organization, or any amount of prior experience or success, should be construed by a client or prospective client as a guarantee that the client will experience a certain level of results if the investment professional or the investment professional’s firm is engaged, or continues to be engaged, to provide investment advisory services. A fee was not paid by either the investment professional or the investment professional’s firm to receive the ranking. The ranking is based upon specific criteria and methodology (see ranking criteria/methodology). No ranking or recognition should be construed as an endorsement by any past or current client of the investment professional or the investment professional’s firm. ANY QUESTIONS: Twelve Points Wealth’s Chief Compliance Officer remains available to address any questions regarding rankings and/or recognitions, including the criteria used for any reflected ranking.
Disclaimer: Historical data is not a guarantee that any of the events described will occur or that any strategy will be successful. Past performance is not indicative of future results. Returns and data cited above are from various sources including FactSet, Bloomberg, Russell Associates, S&P Dow Jones, MSCI Inc., The St. Louis Federal Reserve, and FactSet, Inc. The content is developed from sources believed to be providing accurate information.
The information in this material is not intended as tax or legal advice. Please consult legal or tax professionals for specific information regarding your individual situation. The opinions expressed and material provided are for general information and should not be considered a solicitation for the purchase or sale of any security. Investing involves risks, including possible loss of principal. Please consider the investment objectives, risks, charges, and expenses of any security carefully before investing.
Twelve Points Wealth Management, LLC is an investment adviser located in Concord, Massachusetts. Twelve Points Wealth Management, LLC is registered with the Securities and Exchange Commission (SEC). Registration of an investment adviser does not imply any specific level of skill or training and does not constitute an endorsement of the firm by the Commission. Twelve Points Wealth Management, LLC only transacts business in states in which it is properly registered or is excluded or exempted from registration.
1 Przybylski AK, Murayama K, DeHaan CR, Gladwell V. Motivational, Emotional, and Behavioral Correlates of Fear of Missing Out. Computers in Human Behavior 2013; 29: 1841-1848
2 A Theory of Fads, Fashion, Custom, and Cultural Change as Informational Cascades Sushil Bikhchandani, David Hirshleifer and Ivo Welch. The Journal of Political Economy, Vol. 100, No. 5 (Oct., 1992), pp. 992-1026