The returns for the year 2022 remained deep in negative territory, with nearly all asset classes down double-digits, the exception being the commodity index, which returned nearly 25%, led by energy. The S & P 500® was down 18.2% while the Bloomberg Global Aggregate Bond Index® was down 16.3%. Another standout was the NASDAQ, which declined nearly 34% in 2022, led by Apple (-26%), Tesla (-65%), Amazon (-49%), Meta (-64%) and Nvidia (-50%). The traditional 60/40 portfolio lost -16.1% for the year, putting it firmly in the bottom 20% of 12-month returns for that asset mix over the last nearly 100 years. In contrast, we are pleased to report that, while modestly negative on an absolute basis, all of our risk model portfolios have again outperformed their weighted benchmark for both the fourth quarter as well as the year 2022. By way of example, our Moderate Portfolio (40% Equity / 40% Fixed Income / 20% Liquid Alternatives) outperformed by over 1,000bps for the year 2022 and has returned -4.3% (net of fees), while the portfolio’s weighted benchmark1 returned -14.4%.
The year did end with some improving momentum as most asset classes ended the fourth quarter with positive returns – almost a mirror image of the third quarter. The S & P 500 was up 7.6% during the quarter, the MSCI All-Country World Index® returned nearly 10% and the Bloomberg Global Aggregate Bond Index also rose, climbing nearly 4.5%. Yet again, market volatility caused significant extremes in relative performance: European and Asian Market Equities (+17.7%), U.S. Mid Cap Value (+9.0%) vs. Mid Cap Growth (+9.0%); Mega Cap Growth (+1.1%) vs. Mega Cap Value (+13.2%); Short-term Bonds (+0.7%) vs Long-term Bonds (-5.0%); Industrial Stocks (+19.1%) and Energy Stocks (+22.7%) vs Consumer Discretionary Stocks (-9.1%). Precious metals were up (Gold +10%, Silver +26%) while the broad Commodities index returned a more modest 3%. The 60/40 portfolio returned 5.2% for the quarter.
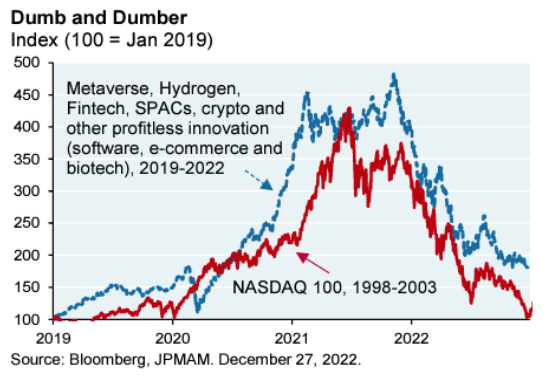
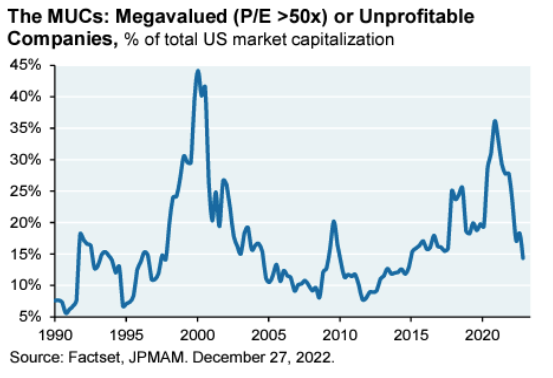
We begin this letter by acknowledging the end of an era. At the end of 2020 – after 15 years of easy monetary policies and benign inflation – global bond markets included over $18 Trillion Dollars of negative yielding debt. As of the first week of January 2023 – all of it is gone as central banks around the World spent the last year hiking interest rates in earnest. Money is no longer free – or more importantly, investors no longer have to pay for the privilege of lending an entity money. Financial markets around the World bent but did not break. Had you asked any market pundit one year ago if the Federal Reserve could hike interest rates by 425 bps over a nine-month period without financial Armageddon, they would have scoffed at the idea, perhaps fainting at the thought. Now that money has a cost, the markets have spent the last year sorting the winners from the losers. Gone (nearly) are the zombie companies that lost money for years but were propped up by a zero cost of capital. As we discussed previously, this shakeout looks very much like the popping of the Internet Bubble 20 years ago (see charts below from JP Morgan):
The distortions in asset pricing were not confined to the capital markets. The run-up in US single-family house prices during and after the pandemic actually exceeded that of the period that preceded the Great Financial Crisis (“GFC”) but without the overhang of excessive leverage.
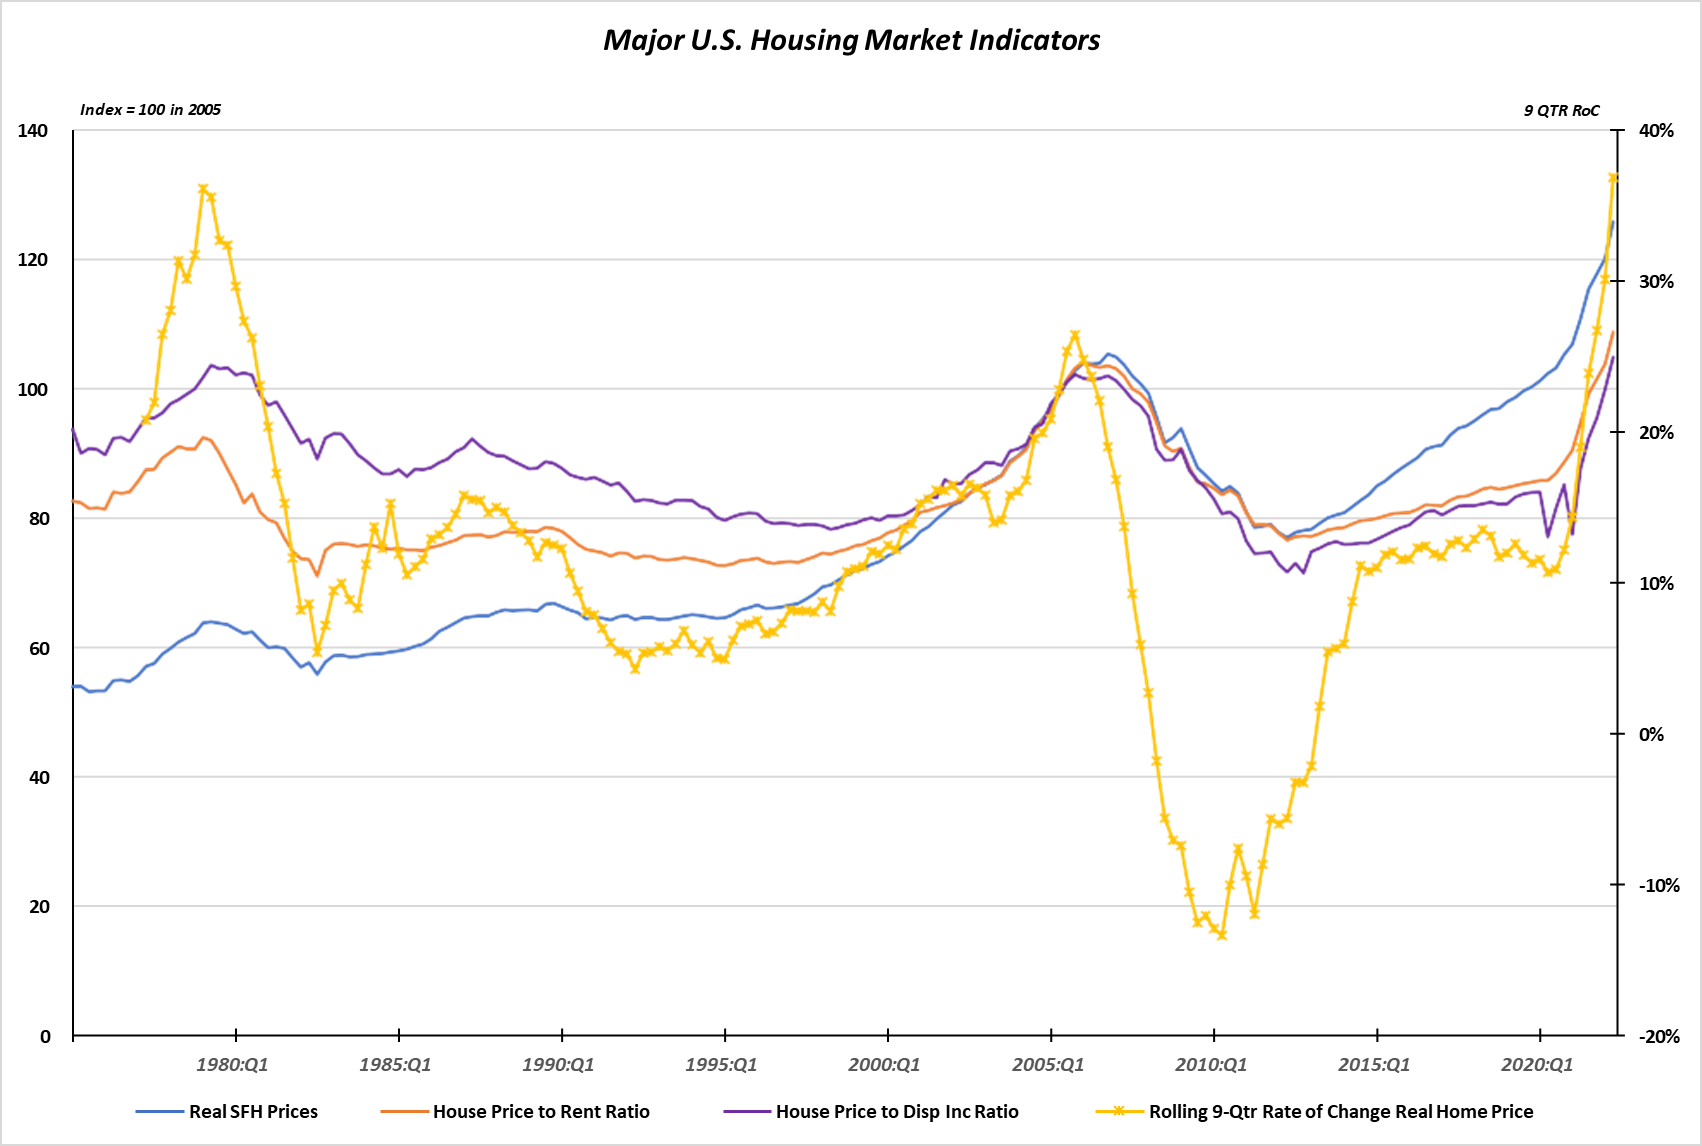
Source: TPW, Federal Reserve Bank of San Francisco
The yellow line represents the nine-quarter rate of change to capture the impact of the pandemic. You can see both the valuation measures and the rate of change in prices exceed that of the period before the GFC. As we have discussed previously, the wealth effect from the rise in home prices in recent years has complicated the Fed’s efforts to slow the economy to bring inflation back to their target of 2.0%.
The recent data on inflation has many market participants proclaiming that inflation has begun to cool and that the Federal Reserve will cut interest rates later this year. While the most volatile components of inflation have indeed begun to decline, that is not where the problem lies nor what the Fed fears the most. The chart below breaks the Consumer Price Index into its three main components: Durables (13% weight), Non-Durables (27%) and Services (60%).
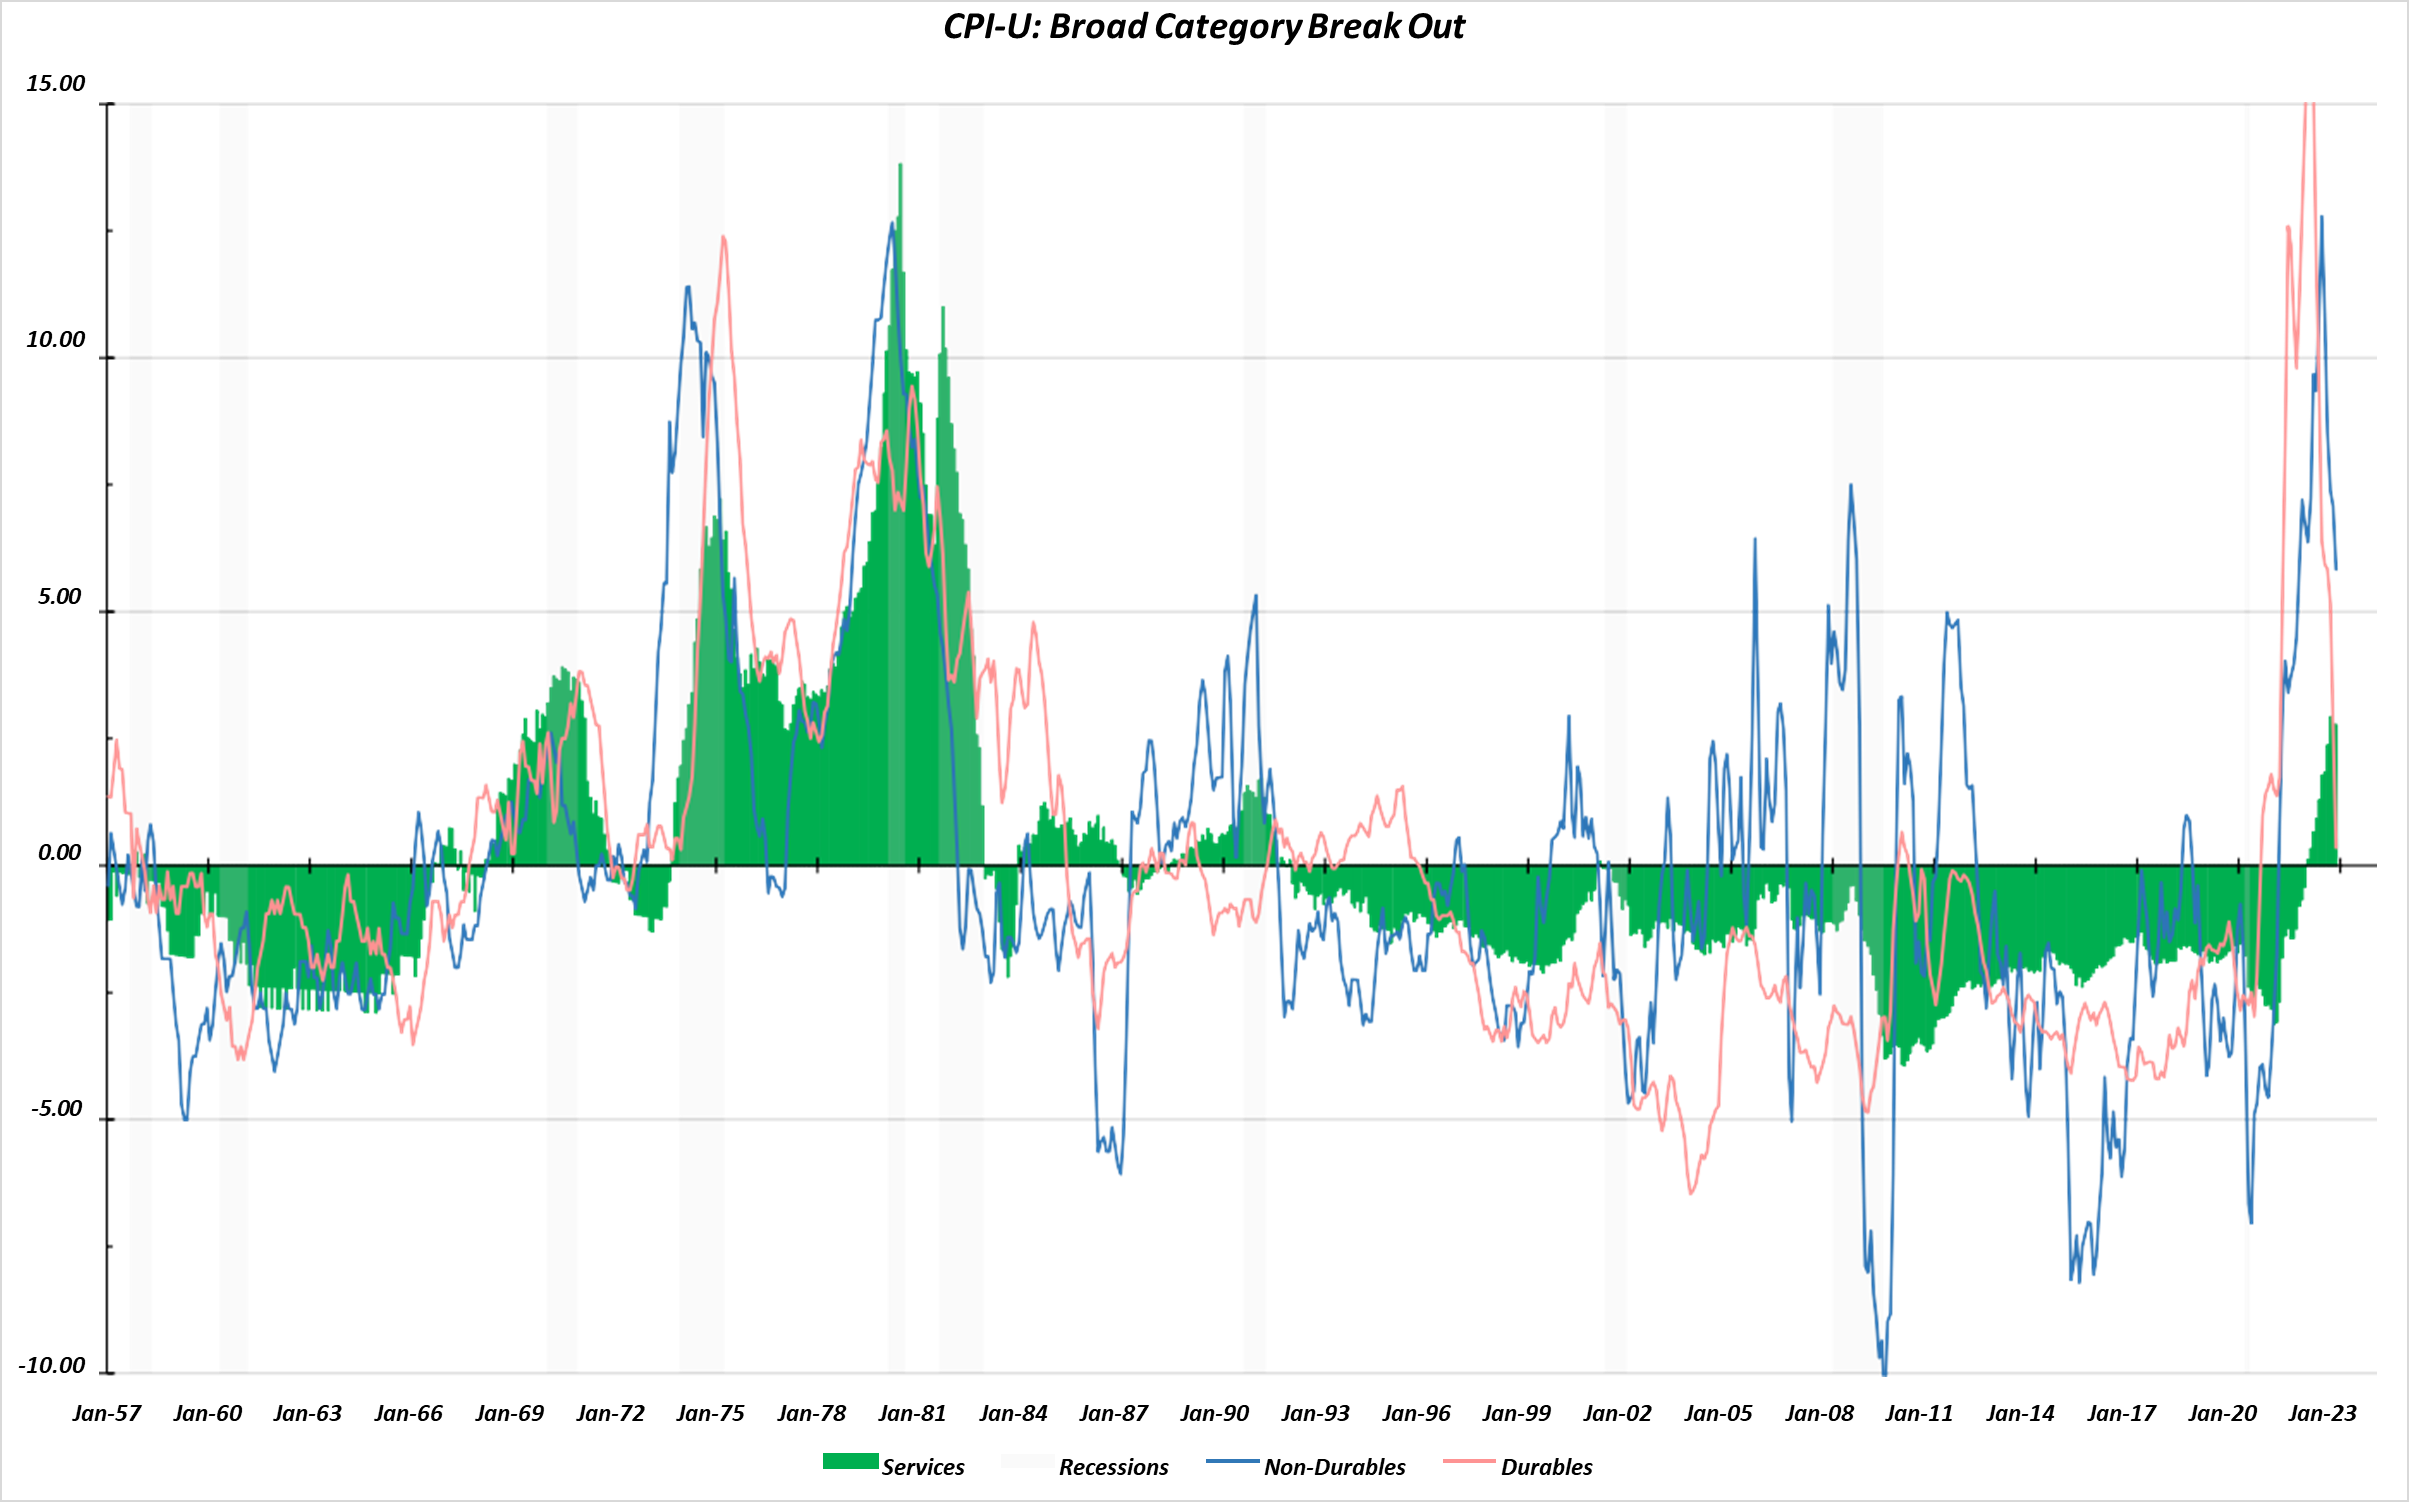 Source: TPW, St. Louis Federal Reserve
As you can see, the Durables (e.g. Washing Machines, Autos) and Non-Durables (e.g. Food, Gasoline) have always been the most volatile (represented by the lines) and why the Federal Reserve strips them out when looking at “Core Inflation.” It is also likely the source of the Fed’s “transitory” narrative early in 2022. What they missed and arguably, where the current problem lies is that the inflationary impulse from those two categories was large enough to wake the beast of services inflation (represented by green columns). The 30 years of benign inflation between 1990 and 2020 (known as the Great Moderation) was built upon the foundation of relatively stable services inflation. The problems with inflation in the mid-1970s to early 1980s ultimately stemmed from services inflation because, by its nature, it is not transitory. The Federal Reserve is singularly focused on not losing control of the green columns in the chart above as they did in the late 1970s.
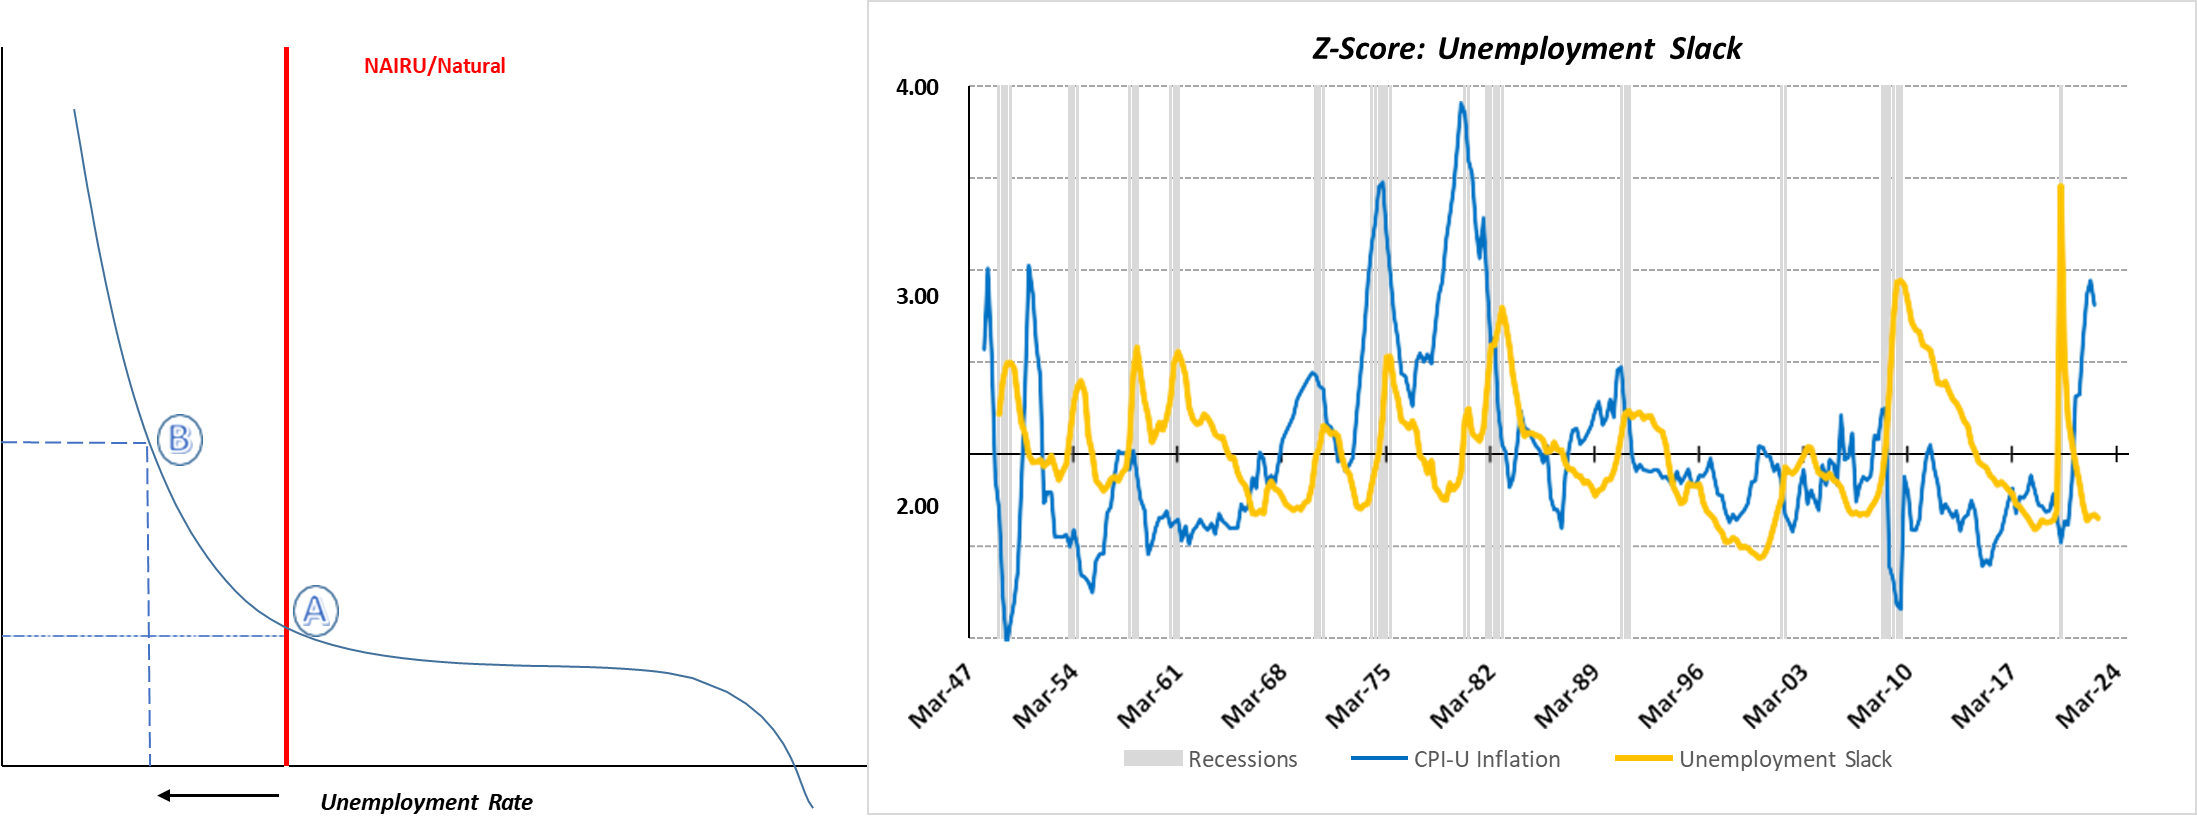
The other significant factor complicating the Fed’s efforts to reduce inflation is the labor market, which remains robust by any measure. Nearly 70% of US gross domestic product comes from consumption, which is directly tied to income levels and consumers’ beliefs regarding the stability of their employment. Recall the chart on the left from one of our previous letters that depicts the problem facing the Fed. The recent unemployment rate of 3.5% (Pt. B below) compares to a Non-Inflationary Rate of Unemployment (Pt. A) that is currently estimated to be approximately 5.0%. The 1.5% of additional unemployment needed to cool wage pressures (currently running at +6.3% YoY) would amount to nearly 2.5 million people out of a job. We created the chart on the right, which looks at multiple measures of the strength of the labor market combined into one indicator that shows how strong this labor market is compared to history.
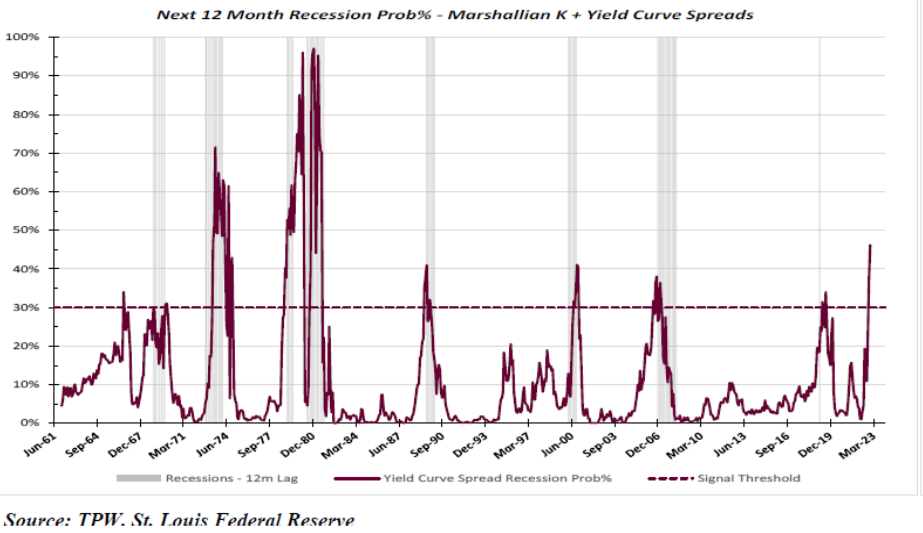
While they will not admit it publicly, the Federal Reserve is trying to engineer a recession to put the inflation genie back in the bottle. Unfortunately, as Philadelphia Fed President Harker recently stated: “Inflation is known to shoot up like a rocket and then come down like a feather.” As a result, most investors believe the US will enter a recession this year or early next year – making it the most anticipated recession ever. While that alone makes the contrarian blood in your author run cold – we do acknowledge the risks of recession are elevated. The chart below is what we use to gauge the risk of recession, and it entered the danger zone in November. Given its nearly perfect track record over the last 60 years of predicting a recession within the next 12 months, we are unwilling to ignore it and have increased the interest rate sensitivity of the fixed income side of your portfolios by bringing the duration in line with that of the benchmark.
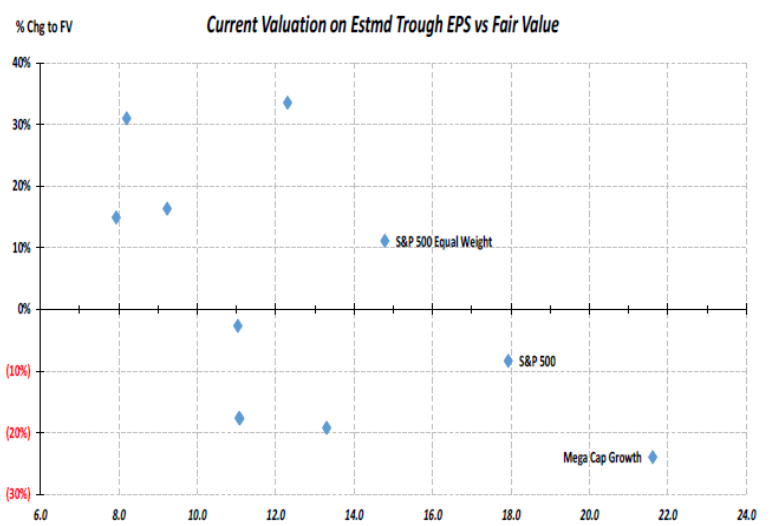
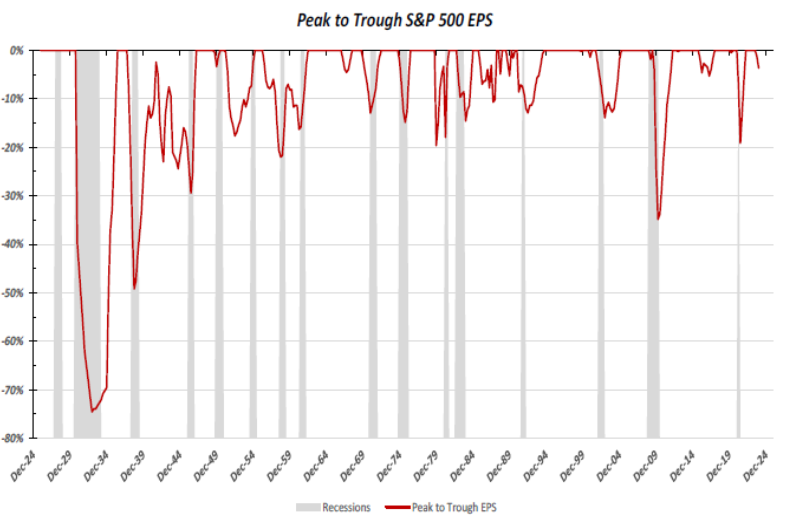
This is being done, after maintaining a duration half thatof the benchmark for the last 18 months, to benefit from the eventual decline in interest rates that normally accompanies a recession. Turning to the equity side of your portfolios, we continue to find attractively valued companies in most parts of the US equity market with the Mega Cap growth stocks continuing to be the glaring exception. Despite this year’s underperformance, the group remains overvalued according to our work that is depicted on the following chart (left) which compares current valuation to our estimate of fair value (which uses real rates, expected inflation and required risk premia). Given where we are in the economic cycle – we prefer to value stocks based on an estimate of earnings adjusted for a recessionary economy, i.e. trough earnings. Looking at the last 100 years (right), the median peak to trough decline for earnings on the S & P 500 has been 10% which is what our valuations are based upon. Looking at the three blue dots with labels, you can see the impact that the Mega Cap stocks continue to have on the valuation of the S &P 500 as the equally weighted S & P 500 (which neutralizes this impact) is undervalued. We continue to believe the quality of the companies in your portfolio and the overall asset allocation will help to mitigate the near-term global economic uncertainty.
We at Twelve Points Wealth hope you and your families are well and wish you a Happy New Year. Please call or email if you have any questions.
Important Disclosure Information
Please remember that past performance is no guarantee of future results. Different types of investments involve varying degrees of risk, and there can be no assurance that the future performance of any specific investment, investment strategy, or product (including the investments and/or investment strategies recommended or undertaken by Twelve Points Wealth Management [“Twelve Points]), or any non-investment related content, made reference to directly or indirectly in this commentary will be profitable, equal any corresponding indicated historical performance level(s), be suitable for your portfolio or individual situation, or prove successful. Due to various factors, including changing market conditions and/or applicable laws, the content may no longer be reflective of current opinions or positions. Moreover, you should not assume that any discussion or information contained in this commentary serves as the receipt of, or as a substitute for, personalized investment advice from Twelve Points. Twelve Points is neither a law firm, nor a certified public accounting firm, and no portion of the commentary content should be construed as legal or accounting advice. A copy of the Twelve Points’ current written disclosure Brochure discussing our advisory services and fees continues to remain available upon request or at www.twelvepointswealth.com. Please Remember: If you are a Twelve Points client, please contact Twelve Points, in writing, if there are any changes in your personal/financial situation or investment objectives for the purpose of reviewing/evaluating/revising our previous recommendations and/or services, or if you would like to impose, add, or to modify any reasonable restrictions to our investment advisory services. Unless, and until, you notify us, in writing, to the contrary, we shall continue to provide services as we do currently. Please Also Remember to advise us if you have not been receiving account statements (at least quarterly) from the account custodian.
Historical performance results for investment indices, benchmarks, and/or categories have been provided for general informational/comparison purposes only, and generally do not reflect the deduction of transaction and/or custodial charges, the deduction of an investment management fee, nor the impact of taxes, the incurrence of which would have the effect of decreasing historical performance results. It should not be assumed that your Twelve Points account holdings correspond directly to any comparative indices or categories. Please Also Note: (1) performance results do not reflect the impact of taxes; (2) comparative benchmarks/indices may be more or less volatile than your Twelve Points accounts; and (3) a description of each comparative benchmark/index is available upon request.
*Please Note: Ranking Limitations. Neither rankings nor recognitions by unaffiliated rating services, publications, media, or other organizations, nor the achievement of any professional designation, certification, degree, or license, membership in any professional organization, or any amount of prior experience or success, should be construed by a client or prospective client as a guarantee that the client will experience a certain level of results if the investment professional or the investment professional’s firm is engaged, or continues to be engaged, to provide investment advisory services. A fee was not paid by either the investment professional or the investment professional’s firm to receive the ranking. The ranking is based upon specific criteria and methodology (see ranking criteria/methodology). No ranking or recognition should be construed as an endorsement by any past or current client of the investment professional or the investment professional’s firm. ANY QUESTIONS: Twelve Points’ Chief Compliance Officer remains available to address any questions regarding rankings and/or recognitions, including the criteria used for any reflected ranking.
Disclaimer: Historical data is not a guarantee that any of the events described will occur or that any strategy will be successful. Past performance is not indicative of future results. Returns and data cited above are from various sources including Factset, Bloomberg, Russell Associates, S&P Dow Jones, MSCI Inc., The St. Louis Federal Reserve, and Factset, Inc. The content is developed from sources believed to be providing accurate information.
The information in this material is not intended as tax or legal advice. Please consult legal or tax professionals for specific information regarding your individual situation. The opinions expressed and material provided are for general information and should not be considered a solicitation for the purchase or sale of any security. Investing involves risks, including possible loss of principal. Please consider the investment objectives, risks, charges, and expenses of any security carefully before investing.
Twelve Points Wealth Management, LLC is an investment adviser located in Concord, Massachusetts. Twelve Points Wealth Management, LLC is registered with the Securities and Exchange Commission (SEC). Registration of an investment adviser does not imply any specific level of skill or training and does not constitute an endorsement of the firm by the Commission. Twelve Points Wealth Management, LLC only transacts business in states in which it is properly registered or is excluded or exempted from registration.