Markets Wobble as Economic Growth and Inflation Concerns Rattle Investors
The S&P 500 fell 4.6% during the quarter, while the MSCI All-Country World Index fell nearly 1%, and the Bloomberg Global Aggregate Bond Index rose 2.6%, as concerns over U.S. economic growth and persistent inflation drove investors to markets outside the U.S. Investors exited richly valued U.S. mega-cap growth stocks, which fell by nearly 16%, while in contrast the equal-weighted S&P 500 was down only 1%. The growth stock weakness extended beyond the Mega Caps with the NASDAQ 100 down over 8% and the Russell 2000 Growth down over 11%. Value stocks were not spared as Midcap and Small Cap Value fell 5% and 11% respectively. Returns outside the US were largely positive with Developed Markets (EAFE) up 8% and Emerging Markets up 4.5%. Short-term bonds in the U.S. were up 1.6%, while long-term bonds, were also up, rising 4.4%. Global bonds, excluding U.S. issues, rose 2.5%, recovering somewhat from last quarter’s rout. Among U.S. sectors, most were positive: materials stocks (+2%), consumer staples (+4%), healthcare (+6%), financials (+3%), real estate (+3%), and utilities (+4%). However, consumer discretionary stocks (-12%) and technology (-11%) were dragged down by the aforementioned weakness in the Magnificent Seven. Commodities were strong this quarter, with gold prices reaching all-time highs (+19%) and broad commodity indexes rising roughly 9%.
The traditional U.S. 60/40 portfolio—widely used as a balanced investment strategy—declined 1.4% for the quarter, reflecting the weakness in stocks. Despite the choppy environment, our risk model portfolios performed in-line their benchmarks.
Market Uncertainty Rises as Policy Shifts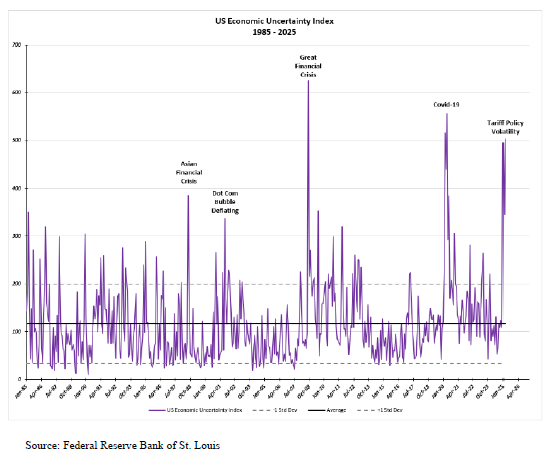
Volatility weighed heavily on U.S. markets as the Nasdaq entered correction territory during the quarter, defined as a 10% decline from recent highs, a threshold reached on Feb. 20. The surge in market uncertainty coincides with shifting economic policies under the new administration, which has contributed to heightened investor anxiety. The U.S. Economic Policy Uncertainty Index, tracked by the Federal Reserve Bank of St. Louis, has soared nearly fivefold since the start of the year—an increase comparable to the early months of the 2020 pandemic. As the adjacent chart illustrates, the index had hovered near its long-term average of 116 at the close of 2024 before its rapid escalation.
Why Markets Dislike Uncertainty
Stock markets thrive on predictability, and when uncertainty rises, investors struggle to accurately assess corporate valuations. Markets rely on projections of future earnings, economic growth, and stability. When those assumptions become unreliable—whether due to geopolitical risks, policy shifts, or economic downturns—valuations become harder to justify, leading to increased volatility. Uncertainty also magnifies perceived investment risks. Historically, investors favor stable returns over potentially higher but unpredictable gains. When faced with unclear economic signals, many shift toward preserving capital, triggering broader market sell-offs. At the corporate level, uncertainty discourages business investment, hiring, and expansion, all of which can weigh on financial performance and stock prices. Behavioral factors play a role as well. Market downturns often become self-reinforcing, as investor anxiety fuels selling pressure, driving prices lower and exacerbating volatility.
A Long-Term Strategy Over Market Fads
Given the current environment, investors frequently ask how we are positioning portfolios to navigate key themes—whether to hedge against rising interest rates, capitalize on “Trump trades,” or ride the wave of artificial intelligence. History offers a clear lesson: markets have weathered booms, busts, wars, crises, and pandemics over the past century. Reacting to every short-term trend would leave investors chasing the market’s fleeting attention. Instead, we adhere to a disciplined dual mandate: maximizing our client’s inflation-adjusted purchasing power over time while minimizing exposure to severe drawdowns. This strategy hinges on broad diversification beyond the traditional stock-and-bond mix, incorporating real assets such as real estate, gold and other alternative assets (Alts). This approach not only enhances risk-adjusted returns, as measured by the Sharpe Ratio (return/volatility of returns), but has also demonstrated superior performance across nearly all phases of the economic cycle.
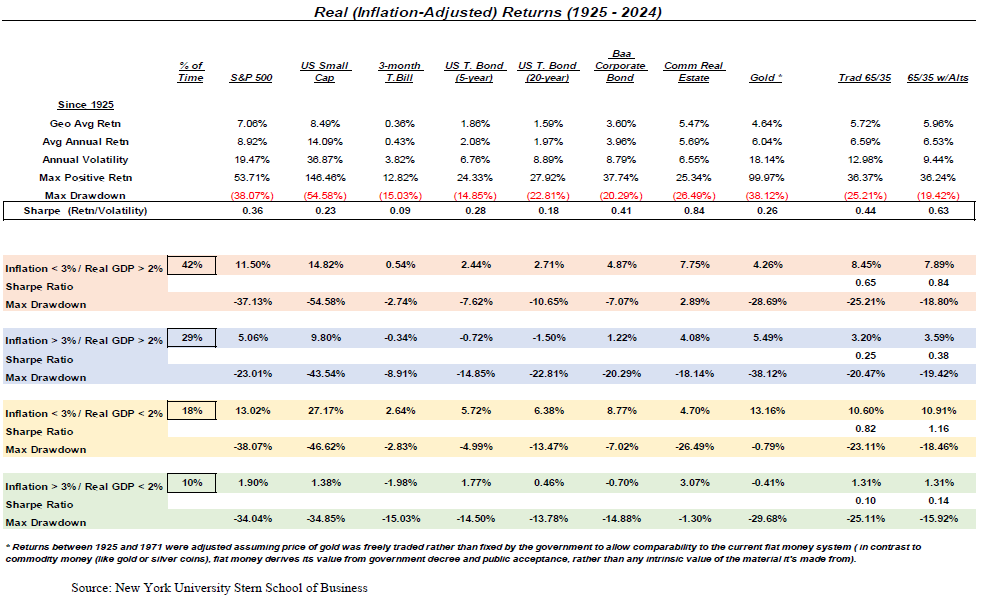
The above table, compiled using data from the NYU Stern School of Business, categorizes historical market performance since 1925. The color-coded lines above are buckets roughly associated with different phases of the economic cycle: Recovery (orange); Boom (blue); Recession/Downturn (yellow); Stagflation (green). Worries over tariff policy and mixed economic data during the first quarter of 2025 has raised the specter of stagflation among both stock and bond investors. While stagflation has been rare — occurring just 10% of the time over the last 100 years — it has delivered the weakest inflation-adjusted returns, as monetary and fiscal policy tools tend to struggle under such conditions. Stagflation—characterized by the rare combination of high inflation, slow economic growth, and high unemployment—is particularly challenging to combat because the typical policy tools used to address inflation and economic stagnation work against each other.
How Stagflation puts Policymakers between a Rock and a Hard Place
1. Inflation vs. Growth Dilemma
To fight inflation, central banks typically raise interest rates to cool demand. However, higher rates also make borrowing more expensive, slowing business investment and consumer spending—potentially worsening unemployment and economic stagnation. To stimulate growth, policymakers usually cut interest rates or increase government spending. But in a stagflationary environment, such stimulus fuels inflation further, exacerbating the problem.
2. Limited Monetary Policy Options
Central banks like the Federal Reserve primarily use interest rates and money supply controls to regulate the economy. However, during stagflation, these tools become blunt instruments:
- Raising interest rates curbs inflation but worsens unemployment and weakens growth.
- Lowering interest rates might boost employment and growth but fuels inflation.
3. Supply-Side Shocks Are Hard to Fix
Stagflation is often triggered by supply-side shocks—such as oil price spikes, supply chain disruptions, or geopolitical conflicts—that drive up production costs. These issues can’t be fixed with traditional demand-side policies like adjusting interest rates or fiscal spending. Structural reforms, like improving energy production or trade policies, take time to yield results.
4. Policy Lag and Uncertainty
Even if policymakers take action, economic responses take months or years to materialize. Raising rates too aggressively can trigger a deep recession, while acting too slowly can allow inflation to spiral out of control. This uncertainty makes policymakers hesitant, leading to prolonged economic distress.
5. Political Constraints
Governments face immense pressure when addressing stagflation. Politicians often prefer short-term stimulus (such as tax cuts or spending increases) to boost employment and growth, but these measures can worsen inflation. The political cost of making tough decisions—such as cutting spending or raising taxes—often leads to delays or ineffective compromises.
Historical Example: The 1970s Stagflation Crisis
The U.S. experienced severe stagflation in the 1970s, fueled by oil price shocks and loose monetary policy. The Federal Reserve initially hesitated to raise rates aggressively, leading to prolonged inflation. It wasn’t until Paul Volcker, then Fed Chair, drastically raised interest rates in the early 1980s—triggering a deep recession—that inflation was finally tamed.
The Bottom Line
Stagflation presents policymakers with a no-win scenario: Addressing inflation can worsen economic pain, while stimulating growth can fuel price increases. The best long-term solutions often involve structural reforms—such as increasing productivity, improving supply chains, and reducing dependency on volatile commodities—but these take time, making stagflation one of the toughest economic challenges to overcome.
Tariff Escalation Casts Shadow Over Economic Growth and Inflation Outlook
The latest round of tariff announcements from the Trump administration has jolted global markets, as policymakers and investors alike confront renewed uncertainty around trade, inflation, and growth. While the headlines bring some clarity, the substance of the measures skews sharply negative—raising the prospect of stagflation and complicating the Federal Reserve’s policy calculus.
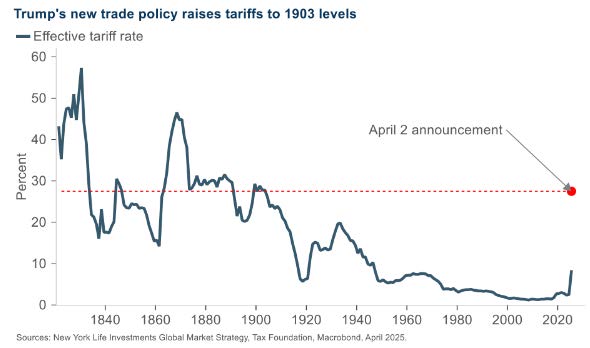
Trade Policy Turns More Punitive
Tariff rates will rise above 10% for 58 countries, including key U.S. trading partners in the European Union. China, singled out for particularly steep penalties, will face an additional 34% in duties—pushing effective tariffs on some goods to 54%. That figure inches closer to the 60% threshold previously floated by President Trump, and marks a significant escalation in the administration’s approach to trade imbalances.
Inflation Expectations Set to Rise
Initial estimates suggest the new tariffs could add roughly 2.5 percentage points to core PCE inflation—an unwelcome acceleration in an already overheated environment. Contrary to the notion that tariffs deliver a one-time price adjustment, history suggests a more protracted impact. In 2018, prices rose gradually, and today’s higher inflation baseline could exacerbate the effect. Consumers and markets had already been bracing for higher inflation. This announcement likely adds fuel to the fire. Longer-term inflation expectations, a key gauge of public confidence, now warrant close attention.
Growth Outlook Dims Sharply
Forecasts for economic growth have deteriorated markedly. Prior to the announcement, second-quarter GDP was expected to rise by 2.0%. Revised estimates now call for a possible contraction of 1.0%. Full-year GDP projections for 2025 have been cut from 2.5% to just 0.5%. Our internal recession risk estimate has increased but loose financial conditions and continued money supply growth do not make a recession our base case at this point. That risk could rise further if the tariffs remain in place or are extended. As discussed above, the Fed faces a narrowing path – with inflation expectations rising, the Federal Reserve may find itself boxed in. Hopes for a near-term rate cut are likely misplaced. While the central bank could respond to a tightening of financial conditions, any action will be contingent on clear signs that inflation is under control or a significant deterioration in the labor market—conditions not currently in evidence.
Corporate Earnings Enter a More Uncertain Phase
Corporate guidance, while still elevated, has begun to deteriorate. As Q1 earnings season unfolds, we expect this trend to accelerate with lower-quality borrowers appearing the most vulnerable. In private markets, large publicly traded funds face heightened pressure, though structural tailwinds remain in place in segments such as the lower middle market. Markets are likely to remain under pressure in the near term. A combination of lower growth expectations and rising inflation risk spells near-term trouble for equities and credit. Valuations may compress, and credit spreads could widen as investors reassess risk.
What Could Change the Trajectory?
Several factors could temper market reaction or prompt a shift in policy:
- A sustained 20% drawdown in equity markets could force a political rethink.
- A breach of 5% on the 10-year Treasury yield due to rising inflation expectations would heighten the pressure, given the drag on growth.
- Soothing rhetoric from administration officials—or swift concessions from high-tariff countries—could ease tensions.
- A surprisingly weak jobs report might raise hopes for a Fed cut, though we caution against such expectations in the near term.
The Tariff Strategy: Tactical or Structural?
Investors have questioned whether this latest salvo is a negotiating tactic or a long-term policy shift. In our view, it’s both. While some countries may negotiate carve-outs, the broader thrust of U.S. trade policy under President Trump has consistently emphasized reducing the trade deficit and bolstering U.S. manufacturing competitiveness. Even with concessions, average global tariff levels are likely to remain elevated relative to recent years. The long-term implications for global supply chains remain unclear.
Our Strategy: Focus on Fundamentals and Resilience
In an environment marked by volatility and shifting policy signals, we remain focused on structural positioning:
- Quality over Leverage: equities with strong cash flows and balance sheets are preferable. We see elevated risk in leveraged companies across the globe.
- Inflation Resilience: Real assets—including gold, industrial metals, and infrastructure—offer inflation-aware exposure. Short-term High-yield credit may offer attractive risk-reward when evaluated on quality and duration.
- Thematic Positioning: Infrastructure and industrial equities are supported by structural trends. Energy, utilities, and materials could benefit from global capex flows and geopolitical tailwinds. While the path of U.S. trade policy remains uncertain, broader shifts—such as supply-chain realignment and re-industrialization—are already underway. We believe investors would do well to align with these enduring trends rather than overreact to short-term noise.
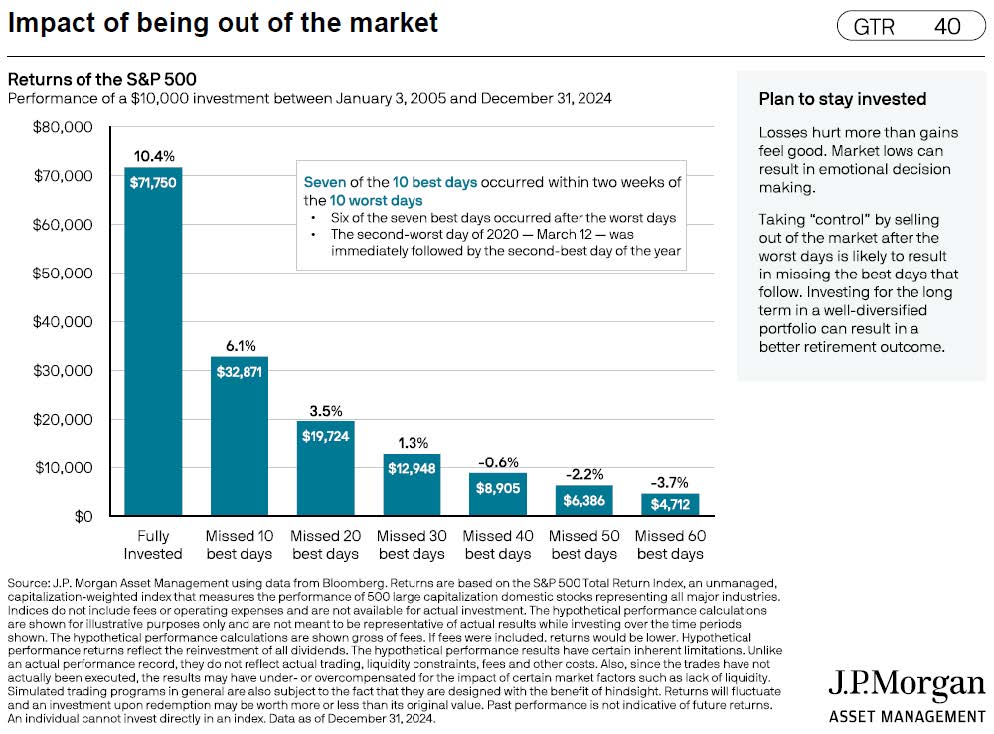
As market conditions continue to evolve, maintaining a disciplined, diversified investment approach remains the most effective strategy for long-term success. The following chart, from JP Morgan, emphasizes the need to stay focused on the long-term and remain invested as missing the best days when the market recovers significantly reduces realized long-term returns:
We at Twelve Points Wealth hope you and your families are well. Please call or email if you have any questions.
Important Disclosure Information
Please remember that past performance is no guarantee of future results. Different types of investments involve varying degrees of risk, and there can be no assurance that the future performance of any specific investment, investment strategy, or product (including the investments and/or investment strategies recommended or undertaken by Twelve Points Wealth Management [“Twelve Points]), or any non-investment related content, made reference to directly or indirectly in this commentary will be profitable, equal any corresponding indicated historical performance level(s), be suitable for your portfolio or individual situation, or prove successful. Due to various factors, including changing market conditions and/or applicable laws, the content may no longer be reflective of current opinions or positions. Moreover, no portion of this discussion or information serves as the receipt of, or a substitute for, personalized investment advice from Twelve Points. Neither Twelve Points’ investment adviser registration status, nor any amount of prior experience or success, should be construed that a certain level of results or satisfaction will be achieved if Twelve Points is engaged, or continues to be engaged, to provide investment advisory services. Twelve Points is neither a law firm, nor a certified public accounting firm, and no portion of the commentary content should be construed as legal or accounting advice. A copy of the Twelve Points’ current written disclosure Brochure discussing our advisory services and fees continues to remain available upon request or at www.twelvepointswealth.com. Please Remember: If you are a Twelve Points client, please contact Twelve Points, in writing, if there are any changes in your personal/financial situation or investment objectives for the purpose of reviewing/evaluating/revising our previous recommendations and/or services, or if you would like to impose, add, or to modify any reasonable restrictions to our investment advisory services. Unless, and until, you notify us, in writing, to the contrary, we shall continue to provide services as we do currently. Please Also Remember to advise us if you have not been receiving account statements (at least quarterly) from the account custodian.
Historical performance results for investment indices, benchmarks, and/or categories have been provided for general informational/comparison purposes only, and generally do not reflect the deduction of transaction and/or custodial charges, the deduction of an investment management fee, nor the impact of taxes, the incurrence of which would have the effect of decreasing historical performance results. It should not be assumed that your Twelve Points account holdings correspond directly to any comparative indices or categories. Please Also Note: (1) comparative benchmarks/indices may be more or less volatile than your Twelve Points accounts; and, (2) a description of each comparative benchmark/index is available upon request.
*Please Note: Ranking Limitations. Neither rankings nor recognitions by unaffiliated rating services, publications, media, or other organizations, nor the achievement of any professional designation, certification, degree, or license, membership in any professional organization, or any amount of prior experience or success, should be construed by a client or prospective client as a guarantee that the client will experience a certain level of results if the investment professional or the investment professional’s firm is engaged, or continues to be engaged, to provide investment advisory services. A fee was not paid by either the investment professional or the investment professional’s firm to receive the ranking. The ranking is based upon specific criteria and methodology (see ranking criteria/methodology). No ranking or recognition should be construed as an endorsement by any past or current client of the investment professional or the investment professional’s firm. ANY QUESTIONS: Twelve Points’ Chief Compliance Officer remains available to address any questions regarding rankings and/or recognitions, including the criteria used for any reflected ranking.
Disclaimer: Historical data is not a guarantee that any of the events described will occur or that any strategy will be successful. Past performance is not indicative of future results. Returns and data cited above are from various sources including FactSet, Bloomberg, Russell Associates, S&P Dow Jones, MSCI Inc., The St. Louis Federal Reserve, and FactSet, Inc. The content is developed from sources believed to be providing accurate information.
The information in this material is not intended as tax or legal advice. Please consult legal or tax professionals for specific information regarding your individual situation. The opinions expressed and material provided are for general information and should not be considered a solicitation for the purchase or sale of any security. Investing involves risks, including possible loss of principal. Please consider the investment objectives, risks, charges, and expenses of any security carefully before investing.
Twelve Points Wealth Management, LLC is an investment adviser located in Concord, Massachusetts. Twelve Points Wealth Management, LLC is registered with the Securities and Exchange Commission (SEC). Registration of an investment adviser does not imply any specific level of skill or training and does not constitute an endorsement of the firm by the Commission. Twelve Points Wealth Management, LLC only transacts business in states in which it is properly registered or is excluded or exempted from registration.